Page 52 - Mirjam-Theelen-Degradation-of-CIGS-solar-cells
P. 52
Chapter 2
10 -1
(a) (b)
( cm) -3 Resitivity increase ( cm/h) 10 -3
Resitivity 10 10 -5
10 -7
ZnO:Al i-ZnO/ZnO:Al ITO ZnO:Al i-ZnO/ZnO:Al ITO
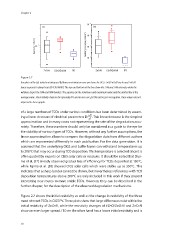
Figure 2.7
Box plots of the (a) initial resistivity and (b) linear resistivity increase per hours for ITO, i-ZnO/ZnO:Al stacks and ZnO:Al
layers exposed to damp heat (85 C/85% RH). The top and bottom of the box show the 25% and 75% intervals, while the
o
whiskers depict the 10% and 90% borders. The squares are the minimum and maximum value and the dashed line is the
average value. The resistivity chances for especially ITO and in one case ZnO:Al can be zero or negative. These values are not
depicted in these graphs.
of a large numbers of TCOs under various conditions has been determined by assum-
ing a linear decrease of electrical parameters D: D . This linear decrease is the simplest
t
approximation and in many cases not representing the rate of the degradation accu-
rately. Therefore, these numbers should only be considered as a guide to the eye for
the stability of various types of TCOs. However, without any further assumptions, the
linear approximation allows to compare the degradation data from different authors
which are represented differently in each publication. For the data generation, it is
assumed that the underlying CIGS and buffer layers can withstand temperatures up
to 200 C that may occur during TCO deposition. This temperature is selected since it is
o
often quoted by experts on CIGS solar cells or modules. It should be noted that Shar-
o
ma et al. [57] already observed gradual loss of efficiency for TCOs deposited at 150 C,
o
while Kijima et al. [58] showed CIGS solar cells which were stable up to 350C. This
indicates that a sharp border cannot be drawn, but nevertheless references with TCO
o
deposition temperatures above 200 C are only included in this work if they present
interesting new routes to more stable TCOs. However, they can be described in the
further chapter, for the description of the observed degradation mechanisms.
Figure 2.7 shows the initial resistivity as well as the change in resistivity of the three
most relevant TCOs in CIGS PV. These plots show that large differences exist within the
initial resistivity of ZnO:Al, while the resistivity changes of i-ZnO/ZnO:Al and ZnO:Al
show an even larger spread. ITO on the other hand has a lower initial resistivity and is
50
10 -1
(a) (b)
( cm) -3 Resitivity increase ( cm/h) 10 -3
Resitivity 10 10 -5
10 -7
ZnO:Al i-ZnO/ZnO:Al ITO ZnO:Al i-ZnO/ZnO:Al ITO
Figure 2.7
Box plots of the (a) initial resistivity and (b) linear resistivity increase per hours for ITO, i-ZnO/ZnO:Al stacks and ZnO:Al
layers exposed to damp heat (85 C/85% RH). The top and bottom of the box show the 25% and 75% intervals, while the
o
whiskers depict the 10% and 90% borders. The squares are the minimum and maximum value and the dashed line is the
average value. The resistivity chances for especially ITO and in one case ZnO:Al can be zero or negative. These values are not
depicted in these graphs.
of a large numbers of TCOs under various conditions has been determined by assum-
ing a linear decrease of electrical parameters D: D . This linear decrease is the simplest
t
approximation and in many cases not representing the rate of the degradation accu-
rately. Therefore, these numbers should only be considered as a guide to the eye for
the stability of various types of TCOs. However, without any further assumptions, the
linear approximation allows to compare the degradation data from different authors
which are represented differently in each publication. For the data generation, it is
assumed that the underlying CIGS and buffer layers can withstand temperatures up
to 200 C that may occur during TCO deposition. This temperature is selected since it is
o
often quoted by experts on CIGS solar cells or modules. It should be noted that Shar-
o
ma et al. [57] already observed gradual loss of efficiency for TCOs deposited at 150 C,
o
while Kijima et al. [58] showed CIGS solar cells which were stable up to 350C. This
indicates that a sharp border cannot be drawn, but nevertheless references with TCO
o
deposition temperatures above 200 C are only included in this work if they present
interesting new routes to more stable TCOs. However, they can be described in the
further chapter, for the description of the observed degradation mechanisms.
Figure 2.7 shows the initial resistivity as well as the change in resistivity of the three
most relevant TCOs in CIGS PV. These plots show that large differences exist within the
initial resistivity of ZnO:Al, while the resistivity changes of i-ZnO/ZnO:Al and ZnO:Al
show an even larger spread. ITO on the other hand has a lower initial resistivity and is
50