Page 13 - Mirjam-Theelen-Degradation-of-CIGS-solar-cells
P. 13
Introduction
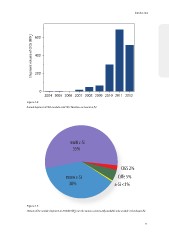
Shipment volume of CIGS (MW p ) 600
400
200
0
2004 2005 2006 2007 2008 2009 2010 2011 2012
Figure 1.4:
Annual shipment of CIGS modules until 2012. Numbers are based on [5].
multi c-Si
55%
CIGS 2%
mono c-Si CdTe 5%
38% a-Si <1%
Figure 1.5:
Division of the module shipments in 2014 (40 GW p ) over the various commercially available solar module technologies [6].
11