Page 67 - Mirjam-Theelen-Degradation-of-CIGS-solar-cells
P. 67
Stability of Cu(In,Ga)Se 2 Solar Cells
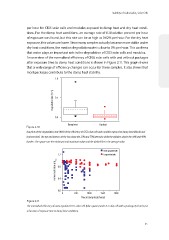
per hour for CIGS solar cells and modules exposed to damp heat and dry heat condi-
tions. For the damp heat conditions, an average rate of 0.18 relative percent per hour
of exposure was found, but this rate can be as high as 0.62% per hour. For the dry heat
exposure, this values are lower. Since many samples actually became more stable under
dry heat conditions, the median degradation rate is close to 0% per hour. This confirms
that water plays an important role in the degradation of CIGS solar cells and modules.
An overview of the normalised efficiency of CIGS solar cells with and without packages
after exposure time to damp heat conditions is shown in Figure 2.11. This graph shows
that a wide range of efficiency changes can occur for these samples. It also shows that
most packages contribute to the damp heat stability.
1.0
Degradation rate (%/η) 0.5
0.0
Dampheat
Dryheat
Damp heat Dry heat
Figure 2.10:
Box plots of the degradation rate (%/h) of the efficiency of CIGS solar cells and modules exposed to damp heat (black) and
dry heat (red). The top and bottom of the box show the 25% and 75% intervals, while the whiskers depict the 10% and 90%
borders. The squares are the minimum and maximum value and the dashed line is the average value.
Unencapsulated cells
1.2 Encapsulated cells
/η t=0
normalised value η 0.8
0.4
0.0
0 500 1000 1500 2000
Time in damp heat (hours)
Figure 2.11
The normalised efficiency of unencapsulated CIGS solar cells (blue squares) and CIGS solar cells with a package (red circles) as
a function of exposure time to damp heat conditions.
65