Page 68 - Mirjam-Theelen-Degradation-of-CIGS-solar-cells
P. 68
Chapter 2
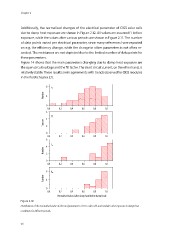
Additionally, the normalised changes of the electrical parameter of CIGS solar cells
due to damp heat exposure are shown in Figure 2.12. All values are assumed 1 before
exposure, while the values after various periods are shown in Figure 2.11. The number
of data points varied per electrical parameter, since many references have reported
on e.g. the efficiency change, while the change in other parameters is not often re-
corded. The resistances are not depicted due to the limited number of data points for
these parameters.
Figure 14 shows that the main parameters changing due to damp heat exposure are
the open circuit voltage and the fill factor. The short circuit current, on the other hand, is
relatively stable. These results are in agreements with trends observed for CIGS modules
in the field (chapter 2.1).
8 η
Number 4
0
0.0 0.2 0.4 0.6 0.8 1.0
6
FF
4
Number 2
0
0.0 0.2 0.4 0.6 0.8 1.0
6
4 Isc
Number 2
0
0.0 0.2 0.4 0.6 0.8 1.0
8 V oc
Number 4
0
0.0 0.2 0.4 0.6 0.8 1.0
Normalised values (after damp heat/before damp heat)
Figure 2.12:
Distributions of the normalised value of electrical parameters of CIGS solar cells and modules after exposure to damp heat
conditions for different periods.
66