Page 100 - Mirjam-Theelen-Degradation-of-CIGS-solar-cells
P. 100
Chapter 3
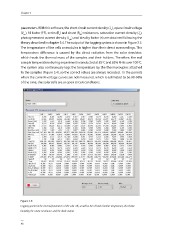
parameters. With this software, the short circuit current density (J sc ), open circuit voltage
(V ), fill factor (FF), series (R ) and shunt (R ) resistances, saturation current density (J ),
s
sh
oc
o
photogenerated current density (J ) and ideality factor (n) are obtained following the
ph
theory described in chapter 3.4. The output of the logging system is shown in Figure 3.5.
The temperature of the cells or modules is higher than their direct surroundings. This
temperature difference is caused by the direct radiation from the solar simulator,
which heats the thermal mass of the samples and their holders. Therefore, the real
o
o
sample temperature during experiments conducted at 85 C and 85% RH is over 100 C.
The system also continuously logs the temperature by the thermocouples attached
to the samples (Figure 3.4), so the correct values are always recorded. In the periods
when the current-voltage curves are not measured, which is estimated to be 90-98%
of the time, the solar cells are at open circuit conditions.
Figure 3.5:
Logging system for the external parameters of the solar cells, as well as the cell and chamber temperature, the relative
humidity, the contact resistances and the diode output.
98