Page 101 - Mirjam-Theelen-Degradation-of-CIGS-solar-cells
P. 101
Experimental information
3.4 IV measurements
In this chapter, the basic theory for the interpretation of the current voltage
measurements, as used in the setup, are shown. The parameters as described in
this chapter are logged in the setup.
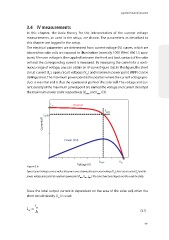
The electrical parameters are determined from current-voltage (IV) curves, which are
2
taken when solar cells are exposed to illumination (normally 1000 W/m , AM 1.5 spec-
trum). A known voltage is then applied between the front and back contact of the solar
cell and the corresponding current is measured. By measuring the current for a conti-
nuous range of voltage, one can obtain an IV-curve ( Figure 3.6). In this figure, the short
circuit current (I ), open circuit voltages (V ) and maximum power point (MPP) can be
oc
sc
distinguished. The maximum power point is the position where the current voltage pro -
duct is maximal and is thus the operational point of the solar cell. The voltage and cur -
rent density at the maximum power point are named the voltage and current densityat
the maximum power point respectively (V MPP and I MPP ) [3].
I sc IV curve
P MPP
I MPP
Current (A)
Power (VxI)
V MPP V oc
Figure 3.6: Voltage (V)
Typical current voltage curve as well as the power curve, showing the open circuit voltage (V oc ), short circuit current (I sc ) and the
power, voltage and current at maximum power point (P MPP , V MPP , I MPP ). The curves have been flipped over the x-axis for clarity.
Since the total output current is dependent on the area of the solar cell, often the
short circuit density (J ) is used:
sc
J=
I sc
sc
A (3.1)
99
3.4 IV measurements
In this chapter, the basic theory for the interpretation of the current voltage
measurements, as used in the setup, are shown. The parameters as described in
this chapter are logged in the setup.
The electrical parameters are determined from current-voltage (IV) curves, which are
2
taken when solar cells are exposed to illumination (normally 1000 W/m , AM 1.5 spec-
trum). A known voltage is then applied between the front and back contact of the solar
cell and the corresponding current is measured. By measuring the current for a conti-
nuous range of voltage, one can obtain an IV-curve ( Figure 3.6). In this figure, the short
circuit current (I ), open circuit voltages (V ) and maximum power point (MPP) can be
oc
sc
distinguished. The maximum power point is the position where the current voltage pro -
duct is maximal and is thus the operational point of the solar cell. The voltage and cur -
rent density at the maximum power point are named the voltage and current densityat
the maximum power point respectively (V MPP and I MPP ) [3].
I sc IV curve
P MPP
I MPP
Current (A)
Power (VxI)
V MPP V oc
Figure 3.6: Voltage (V)
Typical current voltage curve as well as the power curve, showing the open circuit voltage (V oc ), short circuit current (I sc ) and the
power, voltage and current at maximum power point (P MPP , V MPP , I MPP ). The curves have been flipped over the x-axis for clarity.
Since the total output current is dependent on the area of the solar cell, often the
short circuit density (J ) is used:
sc
J=
I sc
sc
A (3.1)
99