Page 244 - Mirjam-Theelen-Degradation-of-CIGS-solar-cells
P. 244
Chapter 8
respectively. Additionally, kapton tape was placed over the molybdenum part ex-
posed to the environment, as shown in Figure 8.1c. This is necessary due to the very
rapid degradation of molybdenum in water, especially when purged with oxygen.
Therefore, unprotected molybdenum can degrade more quickly than the complete
cell, which does not result in relevant measurements.
8.2.2 Sample degradation
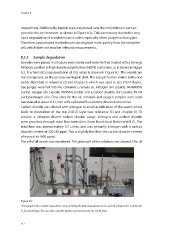
Samples were placed in ultrapure water (deionised water further treated with a Synergy
Millipore purifier) in high density polyethylene (HDPE) containers, as is shown in Figure
8.2. A schematical representation of this setup is shown in Figure 6.1. The vessels are
non transparent, so the samples are kept in dark. The setup is further similar to the one
earlier described in reference [3] and chapter 6, which was used to test ZnO:Al layers.
Gas purges were fed into the containers, namely air, nitrogen (Air Liquide, 99.99995%
purity), oxygen (Air Liquide, 99.995% purity) and a carbon dioxide (Air Liquide, 99.7%
purity)/nitrogen mix. Flow rates for the air, nitrogen and oxygen samples were each
maintained at about 0.3 L/min with calibrated flow meters (Brooks Instrument).
Carbon dioxide was diluted with nitrogen to avoid acidification of the water, which
leads to dissolution of the top ZnO:Al layer (see reference [3] and chapter 6). To
provide a nitrogen-diluted carbon dioxide purge, nitrogen and carbon dioxide
were provided through mass flow controllers (from Bronkhorst Nederland B.V.). The
total flow was approximately 0.7 L/min, and was primarily nitrogen with a carbon
dioxide content of 250±80 ppm. This is slightly less than the carbon dioxide content
of normal air (400 ppm).
The pH of all vessels was monitored. The global pH of the solutions was above 6.5 for all
Figure 8.2
Photograph of the complete degradation setup, including the white degradation vessels, and three flow meters to define the
O 2 , N 2 and air flows. The mass flow controller (right) is used to determine the CO 2 /N 2 flows.
242
respectively. Additionally, kapton tape was placed over the molybdenum part ex-
posed to the environment, as shown in Figure 8.1c. This is necessary due to the very
rapid degradation of molybdenum in water, especially when purged with oxygen.
Therefore, unprotected molybdenum can degrade more quickly than the complete
cell, which does not result in relevant measurements.
8.2.2 Sample degradation
Samples were placed in ultrapure water (deionised water further treated with a Synergy
Millipore purifier) in high density polyethylene (HDPE) containers, as is shown in Figure
8.2. A schematical representation of this setup is shown in Figure 6.1. The vessels are
non transparent, so the samples are kept in dark. The setup is further similar to the one
earlier described in reference [3] and chapter 6, which was used to test ZnO:Al layers.
Gas purges were fed into the containers, namely air, nitrogen (Air Liquide, 99.99995%
purity), oxygen (Air Liquide, 99.995% purity) and a carbon dioxide (Air Liquide, 99.7%
purity)/nitrogen mix. Flow rates for the air, nitrogen and oxygen samples were each
maintained at about 0.3 L/min with calibrated flow meters (Brooks Instrument).
Carbon dioxide was diluted with nitrogen to avoid acidification of the water, which
leads to dissolution of the top ZnO:Al layer (see reference [3] and chapter 6). To
provide a nitrogen-diluted carbon dioxide purge, nitrogen and carbon dioxide
were provided through mass flow controllers (from Bronkhorst Nederland B.V.). The
total flow was approximately 0.7 L/min, and was primarily nitrogen with a carbon
dioxide content of 250±80 ppm. This is slightly less than the carbon dioxide content
of normal air (400 ppm).
The pH of all vessels was monitored. The global pH of the solutions was above 6.5 for all
Figure 8.2
Photograph of the complete degradation setup, including the white degradation vessels, and three flow meters to define the
O 2 , N 2 and air flows. The mass flow controller (right) is used to determine the CO 2 /N 2 flows.
242