Page 248 - Mirjam-Theelen-Degradation-of-CIGS-solar-cells
P. 248
Chapter 8
40
(a) 16 (b)
Efficiency (%) 12 8 H 2 O/N 2 Short circuit current density (mA/cm 2 ) 20 H 2 O/N 2
H 2 O
H 2 O
H 2 O/O 2 H 2 O/O 2
4
H 2 O/CO 2 /N 2 H 2 O/CO 2 /N 2
H 2 O/air H 2 O/air
0 0
0 100 200 300 0 100 200 300
Exposure time (hours) Exposure time (hours)
0.70 80
(c) (d)
oltage (V) 0.65 60
Open circuit v 0.60 H 2 O/N 2 Fill Factor (%) 40
H 2 O
0.55
20
H 2 O/O 2
H 2 O/CO 2 /N 2
0.50 H 2 O/air 0
0 100 200 300 0 100 200 300
Exposure time (hours) Exposure time (hours)
10
(e) 8 H 2 O/N 2 (f)
H 2 O
Series resistance () 4 Light shunt resistance ( cm 2 ) H 2 O/N 2
H 2 O/CO 2 /N 2
H 2 O/air
6 H 2 O/O 2 10 3
H 2 O/O 2
2 H 2 O
H 2 O/CO 2 /N 2
0 10 2 H 2 O/air
0 100 200 300 0 100 200 300
Exposure time (hours) Exposure time (hours)
(g) 10 4
Dark shunt resistance ( cm 2 ) 10 3 H 2 O/N 2
H 2 O
H 2 O/CO 2 /N 2
H 2 O/air
10 2 0 H 2 O/O 2 100 200 300
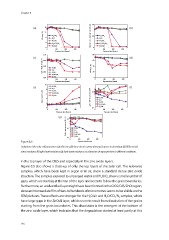
Figure 8.6 Exposure time (hours)
Evolution of the solar cell parameters (a) efficiency (b) short circuit current density (c) open circuit voltage (d) fill factor (e)
series resistance (f) light shunt resistance (g) dark shunt resistance as a function of exposure time to different conditions.
in the top layer of the CIGS and especially in the zinc oxide layers.
Figure 8.5 also shows a close-up of only the top layers of the solar cell. The reference
samples, which have been kept in argon or in air, show a standard dense zinc oxide
structure. The samples exposed to unpurged water and H O/O show a small number of
2
2
gaps, which are starting at the top of the layer and seem to follow the grain boundaries.
Furthermore, an unidentified layer might have been formed in the CIGS/CdS/ZnO region,
since an intermediate film of tens to hundreds of micrometres seems to be visible on the
SEM pictures. These effects are stronger for the H O/air and H O/CO /N samples, which
2
2
2
2
have large gaps in the ZnO:Al layer, which seem to result from dissolution of the grains
starting from the grain boundaries. This dissolution is the strongest at the bottom of
the zinc oxide layer, which indicates that the degradation started at least partly at this
246
40
(a) 16 (b)
Efficiency (%) 12 8 H 2 O/N 2 Short circuit current density (mA/cm 2 ) 20 H 2 O/N 2
H 2 O
H 2 O
H 2 O/O 2 H 2 O/O 2
4
H 2 O/CO 2 /N 2 H 2 O/CO 2 /N 2
H 2 O/air H 2 O/air
0 0
0 100 200 300 0 100 200 300
Exposure time (hours) Exposure time (hours)
0.70 80
(c) (d)
oltage (V) 0.65 60
Open circuit v 0.60 H 2 O/N 2 Fill Factor (%) 40
H 2 O
0.55
20
H 2 O/O 2
H 2 O/CO 2 /N 2
0.50 H 2 O/air 0
0 100 200 300 0 100 200 300
Exposure time (hours) Exposure time (hours)
10
(e) 8 H 2 O/N 2 (f)
H 2 O
Series resistance () 4 Light shunt resistance ( cm 2 ) H 2 O/N 2
H 2 O/CO 2 /N 2
H 2 O/air
6 H 2 O/O 2 10 3
H 2 O/O 2
2 H 2 O
H 2 O/CO 2 /N 2
0 10 2 H 2 O/air
0 100 200 300 0 100 200 300
Exposure time (hours) Exposure time (hours)
(g) 10 4
Dark shunt resistance ( cm 2 ) 10 3 H 2 O/N 2
H 2 O
H 2 O/CO 2 /N 2
H 2 O/air
10 2 0 H 2 O/O 2 100 200 300
Figure 8.6 Exposure time (hours)
Evolution of the solar cell parameters (a) efficiency (b) short circuit current density (c) open circuit voltage (d) fill factor (e)
series resistance (f) light shunt resistance (g) dark shunt resistance as a function of exposure time to different conditions.
in the top layer of the CIGS and especially in the zinc oxide layers.
Figure 8.5 also shows a close-up of only the top layers of the solar cell. The reference
samples, which have been kept in argon or in air, show a standard dense zinc oxide
structure. The samples exposed to unpurged water and H O/O show a small number of
2
2
gaps, which are starting at the top of the layer and seem to follow the grain boundaries.
Furthermore, an unidentified layer might have been formed in the CIGS/CdS/ZnO region,
since an intermediate film of tens to hundreds of micrometres seems to be visible on the
SEM pictures. These effects are stronger for the H O/air and H O/CO /N samples, which
2
2
2
2
have large gaps in the ZnO:Al layer, which seem to result from dissolution of the grains
starting from the grain boundaries. This dissolution is the strongest at the bottom of
the zinc oxide layer, which indicates that the degradation started at least partly at this
246