Page 249 - Mirjam-Theelen-Degradation-of-CIGS-solar-cells
P. 249
The impact of atmospheric species
0 h 0 h
(a) 30 20 h 30 20 h (b)
(mA/cm 2 ) 20 139 h 20 139 h
183 h
183 h
340 h
340 h
Current density 10 Current density (mA/cm 2 ) 10
0
H 2 O/O 2 0 H 2 O/air
0.0 0.5 1.0 0.0 0.5 1.0
Voltage (V) Voltage (V)
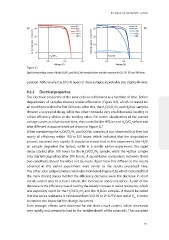
Figure 8.7
Light current voltage curves of the(a) H 2 O/O 2 and (b) H 2 O/air samples before and after exposure for 20, 139, 183 and 340 hours.
position. Additionally, the ZnO:Al layers of these samples is probably also slightly thinner.
8.3.2 Electrical properties
The electrical properties of the solar cells were followed as a function of time. Before
degradation, all samples showed similar efficiencies (Figure 8.6), which increased for
all conditions within the first 50 hours. After this, the H O/CO /N and H O/air samples
2
2
2
2
showed a very rapid decay, while the other showed a very small decrease, leading to
a final efficiency similar to the starting value. For better visualisation of the current
voltage curves as a function of time, the curves for the H O/air and H O/O before and
2
2
2
after different exposure times are shown in Figure 8.7.
When considering the H O/CO /N and H O/air samples, it was observed that they lost
2
2
2
2
nearly all efficiency within 100 to 150 hours, which indicated that the degradation
process occurred very rapidly. It should be noted that in this experiment, the HO/
2
air sample degraded the fastest, while in a similar earlier experiment, the rapid
decay started after 100 hours for the HO/CO /N sample, while the HO/air sample
2
2
2
2
only started degrading after 200 hours. A quantitative comparison between these
two conditions should therefore not be made. Apart from this difference, the results
obtained in this earlier experiment were similar to the results presented here.
The other solar cell parameters were also monitored (Figure 8.6), which indicated that
the main driving forces behind the efficiency decrease were the decrease in short
circuit current and, to a lesser extent, the increase in series resistance. A part of the
decrease in the efficiency was driven by the steady increase in series resistance, which
was especially rapid for the HO/CO /N and the HO/air samples. It should be noted
2
2
2
2
that the series resistance is calculated from V=0.70 to V=0.75V and not at V in order
oc
to remove the impact of the change in current.
Even stronger effects were observed for the short circuit current, which decreased
very rapidly and seemed to lead to the ‘sudden death’ of the solar cells. This complete
247
0 h 0 h
(a) 30 20 h 30 20 h (b)
(mA/cm 2 ) 20 139 h 20 139 h
183 h
183 h
340 h
340 h
Current density 10 Current density (mA/cm 2 ) 10
0
H 2 O/O 2 0 H 2 O/air
0.0 0.5 1.0 0.0 0.5 1.0
Voltage (V) Voltage (V)
Figure 8.7
Light current voltage curves of the(a) H 2 O/O 2 and (b) H 2 O/air samples before and after exposure for 20, 139, 183 and 340 hours.
position. Additionally, the ZnO:Al layers of these samples is probably also slightly thinner.
8.3.2 Electrical properties
The electrical properties of the solar cells were followed as a function of time. Before
degradation, all samples showed similar efficiencies (Figure 8.6), which increased for
all conditions within the first 50 hours. After this, the H O/CO /N and H O/air samples
2
2
2
2
showed a very rapid decay, while the other showed a very small decrease, leading to
a final efficiency similar to the starting value. For better visualisation of the current
voltage curves as a function of time, the curves for the H O/air and H O/O before and
2
2
2
after different exposure times are shown in Figure 8.7.
When considering the H O/CO /N and H O/air samples, it was observed that they lost
2
2
2
2
nearly all efficiency within 100 to 150 hours, which indicated that the degradation
process occurred very rapidly. It should be noted that in this experiment, the HO/
2
air sample degraded the fastest, while in a similar earlier experiment, the rapid
decay started after 100 hours for the HO/CO /N sample, while the HO/air sample
2
2
2
2
only started degrading after 200 hours. A quantitative comparison between these
two conditions should therefore not be made. Apart from this difference, the results
obtained in this earlier experiment were similar to the results presented here.
The other solar cell parameters were also monitored (Figure 8.6), which indicated that
the main driving forces behind the efficiency decrease were the decrease in short
circuit current and, to a lesser extent, the increase in series resistance. A part of the
decrease in the efficiency was driven by the steady increase in series resistance, which
was especially rapid for the HO/CO /N and the HO/air samples. It should be noted
2
2
2
2
that the series resistance is calculated from V=0.70 to V=0.75V and not at V in order
oc
to remove the impact of the change in current.
Even stronger effects were observed for the short circuit current, which decreased
very rapidly and seemed to lead to the ‘sudden death’ of the solar cells. This complete
247