Page 36 - Mirjam-Theelen-Degradation-of-CIGS-solar-cells
P. 36
Chapter 2
rate of the electrical properties as caused by humidity and temperature exposure of
the different groups of molybdenum is shown in Figure 2.1. Additional information on
all the reviewed layers can be found in the supplementary material. The degradation
rates are determined by assuming a linear decrease of the electrical parameter D: D ,
t
where D is R (sheet resistance) or ρ (resistivity). This is the simplest approximation
and in many cases it does not represent the real progression of the degradation ac-
curately. However, without any further assumptions the linear approximation allows
to compare the degradation data from different authors which are represented differ -
ently in each publication.
2.3.1.1 Stability of bare metallic molybdenum
Several studies have reported the impact of moisture, oxygen and temperature on
molybdenum films. It has been concluded that molybdenum degrades through the
formation of a molybdenum oxide (MoO) [18,24,26-27] or Mo(OH) [24] layer on top
3
x
of metallic molybdenum. This formation can be accompanied by large volume ex-
pansion due to the incorporation of oxygen and to the lower density of molybdenum
oxides. The formation of the MoO layer is highly inhomogeneous and often starts at
x
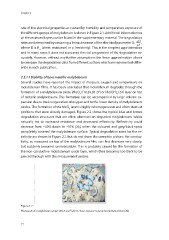
positions that were already damaged. Figure 2.2 shows the typical blue and brown
degradation structures that are often observed on degraded molybdenum, which
naturally led to increased resistance and decreased reflectivity. Reflectivity could
decrease from ~40% down to ~10% [26], when the coloured and grey/black spots
completely covered the molybdenum surface. Typical degradation rates for the re-
sistivity are shown in Figure 2.1, but do not show the complete picture: the conduc-
tivity, as measured on top of the molybdenum film, can first decrease very slowly,
but suddenly becomes unmeasurable. This is probably caused by the formation of
the non-conductive molybdenum oxide layer, which then becomes too thick to be
pierced through with the measurement probes.
Figure 2.2
Photograph of a molybdenum sample (30x25 mm²) after 17 hours exposure to damp heat (obtained from [26]).
34
rate of the electrical properties as caused by humidity and temperature exposure of
the different groups of molybdenum is shown in Figure 2.1. Additional information on
all the reviewed layers can be found in the supplementary material. The degradation
rates are determined by assuming a linear decrease of the electrical parameter D: D ,
t
where D is R (sheet resistance) or ρ (resistivity). This is the simplest approximation
and in many cases it does not represent the real progression of the degradation ac-
curately. However, without any further assumptions the linear approximation allows
to compare the degradation data from different authors which are represented differ -
ently in each publication.
2.3.1.1 Stability of bare metallic molybdenum
Several studies have reported the impact of moisture, oxygen and temperature on
molybdenum films. It has been concluded that molybdenum degrades through the
formation of a molybdenum oxide (MoO) [18,24,26-27] or Mo(OH) [24] layer on top
3
x
of metallic molybdenum. This formation can be accompanied by large volume ex-
pansion due to the incorporation of oxygen and to the lower density of molybdenum
oxides. The formation of the MoO layer is highly inhomogeneous and often starts at
x
positions that were already damaged. Figure 2.2 shows the typical blue and brown
degradation structures that are often observed on degraded molybdenum, which
naturally led to increased resistance and decreased reflectivity. Reflectivity could
decrease from ~40% down to ~10% [26], when the coloured and grey/black spots
completely covered the molybdenum surface. Typical degradation rates for the re-
sistivity are shown in Figure 2.1, but do not show the complete picture: the conduc-
tivity, as measured on top of the molybdenum film, can first decrease very slowly,
but suddenly becomes unmeasurable. This is probably caused by the formation of
the non-conductive molybdenum oxide layer, which then becomes too thick to be
pierced through with the measurement probes.
Figure 2.2
Photograph of a molybdenum sample (30x25 mm²) after 17 hours exposure to damp heat (obtained from [26]).
34