Page 112 - Mirjam-Theelen-Degradation-of-CIGS-solar-cells
P. 112
Chapter 4
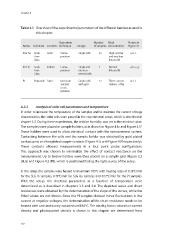
Table 4.1 Overview of the experimental parameters of the different batches as used in
this chapter.
Deposition Number Alkali Picture in
Name Substrate Contacts technique Design of samples concentration Figure 4.1
SLG Au Soda Gold Coeva- Single cells 23 High, normal a, b, c
Lime poration and very low
Glass (Na and K)
SLG In Soda Indium Coeva- Single and 7 Normal a, b, c, g
Lime poration intercon- (Na and K)
Glass nected cells
PI Polyimide Silver Ion-beam Single cells 12 Three concen- d, e, f
assisted with grid trations of Na
coeva-
poration
4.2.2 Analysis of solar cell parameters and temperature
In order to increase the temperature of the samples and to measure the current voltage
characteristics, the solar cells were placed in the experimental setup, which is described in
chapter 3.3. During these experiments, the relative humidity was set to the minimal value.
The samples were placed in sample holders, as is shown in Figure 4.1c and Figure 4.1f.
These holders were used to allow electrical contact with the measurement system.
Contacting between the cells and the sample holder was obtained by gold plated
contact pens or silver plated copper contacts ( Figure 4.1c and Figure 4.1f respectively).
These contacts allowed measurements in a four point probe configuration.
This approach was chosen to minimalize the effect of contact resistance on the
measurement. Up to twelve holders were then placed on a sample grid (Figure 3.2
(SLG) and Figure 4.2 (PI)), which is positioned facing the light source of the setup.
In the setup, the samples were heated to maximum 105C with heating rates of 0.13C/min
o
o
for the SLG In samples, 0.19C/min for SLG Au samples and 0.12C/min for the PI samples.
o
o
With the setup, the electrical parameters as a function of temperature were
determined as is described in chapters 3.3 and 3.4. The depicted series and shunt
resistances were obtained by the determination of the slope of the curves, while the
fitted values are not shown. Since the PI samples showed minor fluctuations in the
current at negative voltages, the determination of the shunt resistance needs to be
treated with care and is only included until 80 C. The ideality factor, saturation current
o
density and photocurrent density is shown in this chapter are determined from
110