Page 116 - Mirjam-Theelen-Degradation-of-CIGS-solar-cells
P. 116
Chapter 4
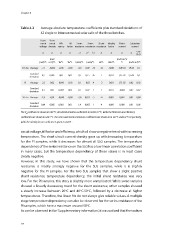
Table 4.2 Average absolute temperature coefficients plus standard deviations of
42 single or interconnected solar cells of the three batches.
Open Short
circuit circuit Effi- Fill Series Series Shunt Ideality Photo- Saturation
voltage density ciency factor resistance resistance resistance factor current current
exp
aT aT aT aT aT aT 2 bT aT aT aT aT (bT)
[mA/ (mA/cm )/
2
[mV]/°C cm ]/°C %/°C %/°C (mΩ)/°C (mΩ)/°C Ω/°C Unit/ C °C (mA/cm )/°C
2
2
o
SLG Au Average -2,1 -0,006 -0,06 -0,09 -9,0 0,09 -20 -16 -0,004 -4,0E-03 1,E-04 0,1
Standard 0,2 0,005 0,01 0,03 9,3 0,15 26 7 0,011 1,1E-02 2,E-04 0,1
deviation
PI Average -2,3 0,02 -0,043 -0,18 0,1 -0,03 4 -3 -0,011 1,7E-02 0,02 0,03
Standard 0,1 0.02 0,004 0,04 0,7 0,02 2 2 0,017 -0,006 0,02 0,02
deviation
SLG In Average -1,9 -0,01 -0,049 -0,08 -2,0 0,023 -5 -4 0,002 0,007 0,01 0,08
Standard
deviation 0,04 0,005 0,003 0,01 1,4 0,005 1 4 0,009 0,009 0,01 0,06
o
2 o
The V oc coefficient is shown in mV/ C, all current densities coefficients in mA/cm / C, while the fill factor and efficiency
o
coefficients are shown in unit / C. The series and shunt resistances coefficients are shown in m Ω/ C and Ω/ C respectively,
o
o
o
while the ideality factor coefficient is given in unit/ C.
circuit voltage, fill factor and efficiency, which all show a negative trend with increasing
temperature. The short circuit current density goes up with increasing temperature
for the PI samples, while it decreases for almost all SLG samples. The temperature
dependency of the series resistance on the SLG has a low linear correlation coefficient
in many cases, but the temperature dependency of these values is in most cases
clearly negative.
However, in this study, we have shown that the temperature dependency shunt
resistance is mostly strongly negative for the SLG samples, while it is slightly
negative for the PI samples. For the two SLG samples that show a slight positive
shunt resistance temperature dependency, the initial shunt resistance was very
low. For the PI samples, this story is slightly more complicated: While some samples
showed a linearly decreasing trend for the shunt resistance, other samples showed
o
a steady increase between 20C and 40C-50 C, followed by a decrease at higher
o
o
temperatures. Therefore, the linear fits do not always give reliable values. A multiple
stage temperature dependency can also be observed for the series resistance of the
PI samples, which have a maximum around 50 C.
o
As can be observed in the ‘ Supplementary information’, it was noticed that the sodium
114