Page 161 - Mirjam-Theelen-Degradation-of-CIGS-solar-cells
P. 161
Degradation mechanisms of the molybdenum back contact
Table 5.9 Overview of the binding energies and areas of the Mo signals as obtained
for non-degraded Mo25/2, degraded Mo25/2 and degraded Mo25/15.
5+
6+
The error on the binding energy is 0.1 eV. r = Mo /(Mo +Mo )
5+
Mo 3d5/2 Mo 6+ Mo 3d5/2 Mo 5+ r
Mo 3d5/2 MoSe 2
E b (eV) area (cps) E b (eV) Area (cps) E b (eV) area (cps)
Mo25/2 non degraded 228.9
Mo25/2 degraded 228.7 8116 232.8 6935 231.6 2338 0.25
Mo25/15 degraded 228.6 1121 232.9 10780 231.7 4081 0.27
MoSe and two other doublets.
2
This can be fitted with three contributions, as can be seen in Table 5.9 . The spectra of
degraded samples also contain the Mo 3d-Se 3s signal corresponding to MoSe , while
2
for the remaining signals, two additional doublets indicating two different Mo oxides
are identified. According to literature values the highest binding energy contribution
is attributed to Mo , while the lowest can be attributed to Mo [30].
5+
6+
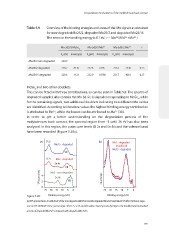
In order to get a better understanding on the degradation process of the
molybdenum back contact, the spectral region from -3 until 26 eV has also been
analysed. In this region, the outer core levels (O 2s and Se 4s) and the valence band
have been recorded (Figure 5.28a).
16 (a) O 2s (b) Mo2 - degraded
Mo15 - degraded
14 (modified)
Mo15 - degraded
12 VB
10 O 2s Mo2 - degraded
8 Se 4s
VB
6
10 2 counts/sec 4 2 Mo2 - non-degraded counts/sec
Se 4s
VB
0
25 20 15 10 5 0 25 20 15 10 5 0
Figure 5.28: Binding energy (eV) Binding energy (eV)
(a) XPS spectra from -3 until 26 eV of the non degraded Mo25/2 and the degraded Mo25/2 and Mo25/15 after 150 hours expo -
sure to 85 C/85% RH. These spectra depict the O 2s, Se 4s and the valence band spectra. (b) Depicts the modified and normalised
o
spectra of degraded Mo25/2 compared with degraded Mo25/15.
159
Table 5.9 Overview of the binding energies and areas of the Mo signals as obtained
for non-degraded Mo25/2, degraded Mo25/2 and degraded Mo25/15.
5+
6+
The error on the binding energy is 0.1 eV. r = Mo /(Mo +Mo )
5+
Mo 3d5/2 Mo 6+ Mo 3d5/2 Mo 5+ r
Mo 3d5/2 MoSe 2
E b (eV) area (cps) E b (eV) Area (cps) E b (eV) area (cps)
Mo25/2 non degraded 228.9
Mo25/2 degraded 228.7 8116 232.8 6935 231.6 2338 0.25
Mo25/15 degraded 228.6 1121 232.9 10780 231.7 4081 0.27
MoSe and two other doublets.
2
This can be fitted with three contributions, as can be seen in Table 5.9 . The spectra of
degraded samples also contain the Mo 3d-Se 3s signal corresponding to MoSe , while
2
for the remaining signals, two additional doublets indicating two different Mo oxides
are identified. According to literature values the highest binding energy contribution
is attributed to Mo , while the lowest can be attributed to Mo [30].
5+
6+
In order to get a better understanding on the degradation process of the
molybdenum back contact, the spectral region from -3 until 26 eV has also been
analysed. In this region, the outer core levels (O 2s and Se 4s) and the valence band
have been recorded (Figure 5.28a).
16 (a) O 2s (b) Mo2 - degraded
Mo15 - degraded
14 (modified)
Mo15 - degraded
12 VB
10 O 2s Mo2 - degraded
8 Se 4s
VB
6
10 2 counts/sec 4 2 Mo2 - non-degraded counts/sec
Se 4s
VB
0
25 20 15 10 5 0 25 20 15 10 5 0
Figure 5.28: Binding energy (eV) Binding energy (eV)
(a) XPS spectra from -3 until 26 eV of the non degraded Mo25/2 and the degraded Mo25/2 and Mo25/15 after 150 hours expo -
sure to 85 C/85% RH. These spectra depict the O 2s, Se 4s and the valence band spectra. (b) Depicts the modified and normalised
o
spectra of degraded Mo25/2 compared with degraded Mo25/15.
159