Page 156 - Mirjam-Theelen-Degradation-of-CIGS-solar-cells
P. 156
Chapter 5
(a) 1 μm (b)
Figure 5.22
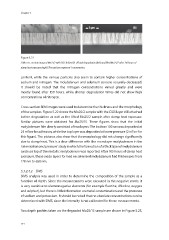
SEM cross-section image of Mo25/2 with CIGS before lift-off and degradation (left) and lifted Mo25/2 after 150 hours of
damp heat exposure (right). The size bars represent 1 micrometres.
content, while the various particles also seem to contain higher concentrations of
sodium and nitrogen. The molybdenum and selenium content naturally decreased.
It should be noted that the nitrogen concentrations varied greatly and were
mostly found after 150 hours, while shorter degradation times did not show high
concentrations of nitrogen.
Cross-section SEM images were used to determine the thickness and the morphology
of the samples. Figure 5.22 shows the Mo25/2 sample with the CIGS layer still attached
before degradation as well as the lifted Mo25/2 sample after damp heat exposure.
Similar pictures were obtained for Mo25/15. These figures show that the initial
molybdenum film clearly consisted of two layers: The bottom 100 nm was deposited at
25 mTorr for adhesion, while the top layer was deposited at lower pressure (2 mTorr for
this figure). The pictures also show that the morphology did not change significantly
due to damp heat. This is a clear difference with the monolayer molybdenum in the
‘selenisation and pressure’ study in which the formation of a thick layer of molybdenum
oxide on top of the metallic molybdenum was reported. After 105 hours of damp heat
exposure, these oxide layers formed on selenised molybdenum had thicknesses from
170 nm to 650 nm.
5.3.2.4.2 SIMS
SIMS analysis was used in order to determine the composition of the sample as a
function of depth. Since the measurements were executed in the negative mode, it
is very sensitive to electronegative elements (for example fluorine, chlorine, oxygen
and sulphur), but there is little information on metal contamination and the presence
of sodium and potassium. It should be noted that no absolute concentrations can be
determined with SIMS, since the intensity is not calibrated for these measurements.
Two depth profiles taken on the degraded Mo25/15 sample are shown in Figure 5.23,
154
(a) 1 μm (b)
Figure 5.22
SEM cross-section image of Mo25/2 with CIGS before lift-off and degradation (left) and lifted Mo25/2 after 150 hours of
damp heat exposure (right). The size bars represent 1 micrometres.
content, while the various particles also seem to contain higher concentrations of
sodium and nitrogen. The molybdenum and selenium content naturally decreased.
It should be noted that the nitrogen concentrations varied greatly and were
mostly found after 150 hours, while shorter degradation times did not show high
concentrations of nitrogen.
Cross-section SEM images were used to determine the thickness and the morphology
of the samples. Figure 5.22 shows the Mo25/2 sample with the CIGS layer still attached
before degradation as well as the lifted Mo25/2 sample after damp heat exposure.
Similar pictures were obtained for Mo25/15. These figures show that the initial
molybdenum film clearly consisted of two layers: The bottom 100 nm was deposited at
25 mTorr for adhesion, while the top layer was deposited at lower pressure (2 mTorr for
this figure). The pictures also show that the morphology did not change significantly
due to damp heat. This is a clear difference with the monolayer molybdenum in the
‘selenisation and pressure’ study in which the formation of a thick layer of molybdenum
oxide on top of the metallic molybdenum was reported. After 105 hours of damp heat
exposure, these oxide layers formed on selenised molybdenum had thicknesses from
170 nm to 650 nm.
5.3.2.4.2 SIMS
SIMS analysis was used in order to determine the composition of the sample as a
function of depth. Since the measurements were executed in the negative mode, it
is very sensitive to electronegative elements (for example fluorine, chlorine, oxygen
and sulphur), but there is little information on metal contamination and the presence
of sodium and potassium. It should be noted that no absolute concentrations can be
determined with SIMS, since the intensity is not calibrated for these measurements.
Two depth profiles taken on the degraded Mo25/15 sample are shown in Figure 5.23,
154