Page 157 - Mirjam-Theelen-Degradation-of-CIGS-solar-cells
P. 157
Degradation mechanisms of the molybdenum back contact
(a) 5 (b) 5 CN -
10 Se - - MoO - 3 H - 10 4 Se - MoO - 3 H -
Intensity (counts) 10 4 3 C - Cl - Intensity (counts) 10 3 C - Cl -
CN
10
10
10 2 Si - 10 2 Si -
10 1 10 1
0 200 400 600 800 0 200 400 600 800
Figure 5.23 Sputtering time (seconds) Sputtering time (seconds)
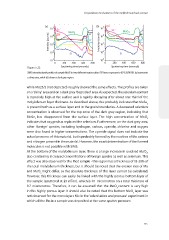
SIMS intensity depth profiles of sample Mo15 in two different regions after 150 hours exposure to 85 C/85% RH. (a) represents
o
a shiny area, while (b) shows a dark grey region.
while Mo25/2 (not depicted) roughly showed the same effects. The profiles are taken
on a ‘shiny’ area and on a dark grey ‘degraded’ area. As expected, the selenium content
is especially high at the surface and is rapidly decaying after about one third of the
molybdenum layer thickness. As described above, this probably indicates that MoSe
2
is present both as a surface layer and in the grain boundaries. A decreased selenium
concentration is observed for the top zone of the dark grey region, indicating that
MoSe has disappeared from the surface layer. The high concentration of MoO
2
3
indicates that oxygen has replaced the selenium. Furthermore, on the dark grey area,
other ‘foreign’ species, including hydrogen, carbon, cyanide, chlorine and oxygen
were also found in higher concentrations. The cyanide signal does not indicate the
actual presence of this material, but is probably formed by the reaction of the carbon
and nitrogen present in the material. However, the exact determination of the formed
molecules is not possible with SIMS.
At the bottom of the molybdenum layer, there is a large increase in oxidised MoO,
x
also containing increased concentrations of foreign species as well as selenium. This
effect was also observed for the Mo2 sample - this region has a thickness of 15-20% of
the total molybdenum thickness, but it should be noted that the erosion rate of Mo
and MoO might differ, so the absolute thickness of this layer cannot be calculated.
x
However, this thickness can easily be linked with the highly porous bottom layer of
the sample (sputtered at 25 mTorr), which is 0.1 micrometres on a total thickness of
0.7 micrometres. Therefore, it can be assumed that the MoOcontent is very high
x
in this highly porous layer. It should also be noted that this bottom MoOlayer was
x
not observed for the monolayers Mo in the ‘selenisation and pressure’ experiment in
which all the Mo in a sample was deposited at the same sputter pressure.
155
(a) 5 (b) 5 CN -
10 Se - - MoO - 3 H - 10 4 Se - MoO - 3 H -
Intensity (counts) 10 4 3 C - Cl - Intensity (counts) 10 3 C - Cl -
CN
10
10
10 2 Si - 10 2 Si -
10 1 10 1
0 200 400 600 800 0 200 400 600 800
Figure 5.23 Sputtering time (seconds) Sputtering time (seconds)
SIMS intensity depth profiles of sample Mo15 in two different regions after 150 hours exposure to 85 C/85% RH. (a) represents
o
a shiny area, while (b) shows a dark grey region.
while Mo25/2 (not depicted) roughly showed the same effects. The profiles are taken
on a ‘shiny’ area and on a dark grey ‘degraded’ area. As expected, the selenium content
is especially high at the surface and is rapidly decaying after about one third of the
molybdenum layer thickness. As described above, this probably indicates that MoSe
2
is present both as a surface layer and in the grain boundaries. A decreased selenium
concentration is observed for the top zone of the dark grey region, indicating that
MoSe has disappeared from the surface layer. The high concentration of MoO
2
3
indicates that oxygen has replaced the selenium. Furthermore, on the dark grey area,
other ‘foreign’ species, including hydrogen, carbon, cyanide, chlorine and oxygen
were also found in higher concentrations. The cyanide signal does not indicate the
actual presence of this material, but is probably formed by the reaction of the carbon
and nitrogen present in the material. However, the exact determination of the formed
molecules is not possible with SIMS.
At the bottom of the molybdenum layer, there is a large increase in oxidised MoO,
x
also containing increased concentrations of foreign species as well as selenium. This
effect was also observed for the Mo2 sample - this region has a thickness of 15-20% of
the total molybdenum thickness, but it should be noted that the erosion rate of Mo
and MoO might differ, so the absolute thickness of this layer cannot be calculated.
x
However, this thickness can easily be linked with the highly porous bottom layer of
the sample (sputtered at 25 mTorr), which is 0.1 micrometres on a total thickness of
0.7 micrometres. Therefore, it can be assumed that the MoOcontent is very high
x
in this highly porous layer. It should also be noted that this bottom MoOlayer was
x
not observed for the monolayers Mo in the ‘selenisation and pressure’ experiment in
which all the Mo in a sample was deposited at the same sputter pressure.
155