Page 159 - Mirjam-Theelen-Degradation-of-CIGS-solar-cells
P. 159
Degradation mechanisms of the molybdenum back contact
α* = E (Na 1s) + E (Na KLL) (5.1)
k
b
(a) 25 Na1s (b) 7 Na KLL
6
20
Mo15 - degraded 5
Mo15 - degraded
15 4
10 Mo2 - degraded 3 Mo2 - degraded
10 3 counts/sec 5 Mo2 - non-degraded 10 3 counts/sec 2 1 Mo2 - non-degraded
0
1076 1074 1072 1070 1068 0 994 992 990 988 986
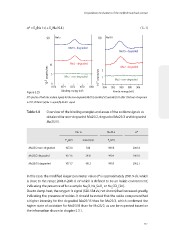
Figure 5.25 Binding energy (eV) Kinetic energy (eV)
XPS spectra of both the sodium signals for the non-degraded Mo25/2 and Mo25/2 and Mo25/15 after 150 hours of exposure
to 85 C/85% RH. (a) Na 1s signal (b) Na KLL signal.
o
Table 5.8 Overview of the binding energies and areas of the sodium signals as
obtained for non-degraded Mo25/2, degraded Mo25/2 and degraded
Mo25/15.
Na 1s Na KLL α*
E b (eV) area (cps) E k (eV)
Mo25/2 non-degraded 1072.0 548 989.8 2061.8
Mo25/2 degraded 1071.6 3850 990.4 2062.0
Mo25/15 degraded 1071.7 4012 990.5 2062.1
In this case, the modified Auger parameter value α* is approximately 2061.9 eV, which
is close to the range 2061.0-2061.6 eV which is defined to be an ‘oxide environment’,
indicating the presence of for example Na O, Na SeO or Na CO [26].
2
2
3
2
3
Due to damp heat, the oxygen 1s signal (528-534 eV, not shown) had increased greatly,
indicating the presence of oxides. It should be noted that the oxide component had
a higher intensity for the degraded Mo25/15 than for Mo25/2, which confirmed the
higher state of oxidation for Mo25/15 than for Mo25/2, as can be expected based on
the information shown in chapter 5.3.1.
157
α* = E (Na 1s) + E (Na KLL) (5.1)
k
b
(a) 25 Na1s (b) 7 Na KLL
6
20
Mo15 - degraded 5
Mo15 - degraded
15 4
10 Mo2 - degraded 3 Mo2 - degraded
10 3 counts/sec 5 Mo2 - non-degraded 10 3 counts/sec 2 1 Mo2 - non-degraded
0
1076 1074 1072 1070 1068 0 994 992 990 988 986
Figure 5.25 Binding energy (eV) Kinetic energy (eV)
XPS spectra of both the sodium signals for the non-degraded Mo25/2 and Mo25/2 and Mo25/15 after 150 hours of exposure
to 85 C/85% RH. (a) Na 1s signal (b) Na KLL signal.
o
Table 5.8 Overview of the binding energies and areas of the sodium signals as
obtained for non-degraded Mo25/2, degraded Mo25/2 and degraded
Mo25/15.
Na 1s Na KLL α*
E b (eV) area (cps) E k (eV)
Mo25/2 non-degraded 1072.0 548 989.8 2061.8
Mo25/2 degraded 1071.6 3850 990.4 2062.0
Mo25/15 degraded 1071.7 4012 990.5 2062.1
In this case, the modified Auger parameter value α* is approximately 2061.9 eV, which
is close to the range 2061.0-2061.6 eV which is defined to be an ‘oxide environment’,
indicating the presence of for example Na O, Na SeO or Na CO [26].
2
2
3
2
3
Due to damp heat, the oxygen 1s signal (528-534 eV, not shown) had increased greatly,
indicating the presence of oxides. It should be noted that the oxide component had
a higher intensity for the degraded Mo25/15 than for Mo25/2, which confirmed the
higher state of oxidation for Mo25/15 than for Mo25/2, as can be expected based on
the information shown in chapter 5.3.1.
157