Page 182 - Mirjam-Theelen-Degradation-of-CIGS-solar-cells
P. 182
Chapter 6
Glass/ZnO:Al
samples
Figure 6.1
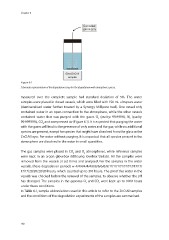
Schematic representation of the degradation setup for the degradation with atmospheric species.
Figure 6.1 Schematic picture of the
measured over the complete sample had standard deviation of 5%. The water
degradation setup
samples were placed in closed vessels, which were filled with 150 mL ultrapure water
(demineralised water further treated by a Synergy Millipore tool). One vessel only
contained water in an open connection to the atmosphere, while the other vessels
contained water that was purged with the gases O (purity: 99.995%), N (purity:
2
2
99.99995%), CO and compressed air (Figure 6.1). It is expected that purging the water
2
with the gases will lead to the presence of only water and the gas, while no additional
species are present, except for species that might have dissolved from the glass or the
ZnO:Al layer. For water without purging, it is expected that all species present in the
atmosphere are dissolved in the water in small quantities.
The gas samples were placed in CO and O atmospheres, while reference samples
2
2
were kept in an argon glovebox (MBraung lovebox Unilab). All the samples were
removed from the vessels at set times and analysed. For the samples in the water
vessels, these degradation periods w 4/4/4/4/4/4/6/6/6/6/6/6/17/17/17/17/17/17/17/17/
17/17/20/20/20/20 hours, which counted up to 310 hours. The pH of the water in the
vessels was checked before the removal of the samples, to observe whether the pH
has changed. The samples in the gaseous O and CO were kept up to 1000 hours
2
2
under these conditions.
In Table 6.1 , sample abbreviations used in this article to refer to the ZnO:Al samples
and the conditions of the degradation experiments of the samples are summarised.
180
Glass/ZnO:Al
samples
Figure 6.1
Schematic representation of the degradation setup for the degradation with atmospheric species.
Figure 6.1 Schematic picture of the
measured over the complete sample had standard deviation of 5%. The water
degradation setup
samples were placed in closed vessels, which were filled with 150 mL ultrapure water
(demineralised water further treated by a Synergy Millipore tool). One vessel only
contained water in an open connection to the atmosphere, while the other vessels
contained water that was purged with the gases O (purity: 99.995%), N (purity:
2
2
99.99995%), CO and compressed air (Figure 6.1). It is expected that purging the water
2
with the gases will lead to the presence of only water and the gas, while no additional
species are present, except for species that might have dissolved from the glass or the
ZnO:Al layer. For water without purging, it is expected that all species present in the
atmosphere are dissolved in the water in small quantities.
The gas samples were placed in CO and O atmospheres, while reference samples
2
2
were kept in an argon glovebox (MBraung lovebox Unilab). All the samples were
removed from the vessels at set times and analysed. For the samples in the water
vessels, these degradation periods w 4/4/4/4/4/4/6/6/6/6/6/6/17/17/17/17/17/17/17/17/
17/17/20/20/20/20 hours, which counted up to 310 hours. The pH of the water in the
vessels was checked before the removal of the samples, to observe whether the pH
has changed. The samples in the gaseous O and CO were kept up to 1000 hours
2
2
under these conditions.
In Table 6.1 , sample abbreviations used in this article to refer to the ZnO:Al samples
and the conditions of the degradation experiments of the samples are summarised.
180