Page 186 - Mirjam-Theelen-Degradation-of-CIGS-solar-cells
P. 186
Chapter 6
atom mobility and cause re-evapouration of poorly combined structures. Therefore,
higher deposition temperatures in general result in a lower deposition rates (thickness/
time) and more dense films [11].
During degradation, no change in shape or size of the grains was observed. Similarly,
the thickness of the samples did not change significantly, which is in contrast to results
reported in reference [9], which reported that exposed zinc oxide films were five to
ten times thicker than their originals, as a result of damp heat induced degradation.
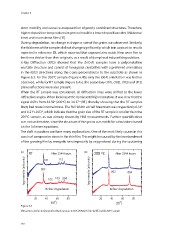
X-Ray Diffraction (XRD) showed that the ZnO:Al samples have a polycrystalline
wurtzite structure and consist of hexagonal crystallites with a preferred orientation
in the (002) directions along the c-axis perpendicular to the substrate as shown in
o
Figure 6.3. For the 200 C sample (Figure 6.4b), only the (004) orientation was further
observed, while for RT sample (Figure 6.4a), the secondary (101), (102), (103) and (112)
plane reflections were also present.
When the RT sample was considered, all diffraction lines were shifted to the lower
diffraction angles. When looking at the dominant (002) orientation, it was clear that the
o
o
signal shifts from 34.59 (200 C) to 34.37 (RT), thereby showing that the RT samples
o
o
likely had more internal stress. The Full Width at Half Maximum was respectively 0.14
and 0.21 ±0.03 , which indicate that the grain size of the RT sample is smaller than the
o
o
o
200 C sample, as was already shown by HIM measurements. Further quantification
was not undertaken, since the structure of the grains was not fit for calculations based
on the Scherrer equations.
The shift in position can have many explanations. One of the most likely causes in this
case is of compressive stress in the thin film. This might be caused by the bombardment
of the growing film by energetic ions (especially by oxygen ions) during the sputtering
(a) After 2344 hours (b) o After 2344 hours
log intensity (arb.units) RT 002 101 103 004 log intensity (arb.units) 200 C 002 004
112
102
Before degradation Before degradation
20 40 60 80 20 40 60 80
o
2(θ ) 2(θ )
o
Figure 6.4
XRD patterns before (red) and after (blue) exposure to 85 C/85% RH of the (a) RT and (b) 200 C sample.
o
o
184
atom mobility and cause re-evapouration of poorly combined structures. Therefore,
higher deposition temperatures in general result in a lower deposition rates (thickness/
time) and more dense films [11].
During degradation, no change in shape or size of the grains was observed. Similarly,
the thickness of the samples did not change significantly, which is in contrast to results
reported in reference [9], which reported that exposed zinc oxide films were five to
ten times thicker than their originals, as a result of damp heat induced degradation.
X-Ray Diffraction (XRD) showed that the ZnO:Al samples have a polycrystalline
wurtzite structure and consist of hexagonal crystallites with a preferred orientation
in the (002) directions along the c-axis perpendicular to the substrate as shown in
o
Figure 6.3. For the 200 C sample (Figure 6.4b), only the (004) orientation was further
observed, while for RT sample (Figure 6.4a), the secondary (101), (102), (103) and (112)
plane reflections were also present.
When the RT sample was considered, all diffraction lines were shifted to the lower
diffraction angles. When looking at the dominant (002) orientation, it was clear that the
o
o
signal shifts from 34.59 (200 C) to 34.37 (RT), thereby showing that the RT samples
o
o
likely had more internal stress. The Full Width at Half Maximum was respectively 0.14
and 0.21 ±0.03 , which indicate that the grain size of the RT sample is smaller than the
o
o
o
200 C sample, as was already shown by HIM measurements. Further quantification
was not undertaken, since the structure of the grains was not fit for calculations based
on the Scherrer equations.
The shift in position can have many explanations. One of the most likely causes in this
case is of compressive stress in the thin film. This might be caused by the bombardment
of the growing film by energetic ions (especially by oxygen ions) during the sputtering
(a) After 2344 hours (b) o After 2344 hours
log intensity (arb.units) RT 002 101 103 004 log intensity (arb.units) 200 C 002 004
112
102
Before degradation Before degradation
20 40 60 80 20 40 60 80
o
2(θ ) 2(θ )
o
Figure 6.4
XRD patterns before (red) and after (blue) exposure to 85 C/85% RH of the (a) RT and (b) 200 C sample.
o
o
184