Page 187 - Mirjam-Theelen-Degradation-of-CIGS-solar-cells
P. 187
Degradation mechanisms of the aluminium doped zinc oxide front contact
process. Oxygen has a small atomic diameter and creates interstitial alloys with many
materials, which can expand the lattice structure.
Furthermore, the (002) and (004) lines are asymmetric, which is somewhat unusual. This
asymmetry can be caused by presence of a second phase with a different structure or
composition. It is suggested that this effect is observed when the substrate is located
directly below the erosive zone of the target in magnetron sputtering unit, where
the concentration of negative oxygen ions is the highest. Those ions are accelerated
on the substrate and are implanted into the film and occupy the interstitial positions.
This asymmetry effect could probably be countered by post-deposition heating, but
this is probably not possible for CIGS cells, which cannot stand temperatures above
o
approximately 200 C.
After degradation, the number and general position of the orientation did not change,
which indicated that structural properties were constant. The position and intensity
changed slightly but this change is within the measurement variation of the XRD.
6.3.1.2 Surface evaluation
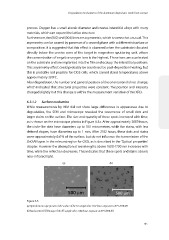
While measurements by HIM did not show large differences in appearance due to
degradation, the SEM and microscope revealed the occurrence of small dots and
larger stains on the surface. The size and quantity of these spots increased with time,
as is shown on the microscope photos in Figure 6.5a. After approximately 2000 hours,
the circle-like dots have diameters up to 100 micrometres, while the stains, with less
defined shapes, have diameters up to 1 mm. After 2182 hours, these dots and stains
cover approximately 6±1% of the surface, but do not influence the transmission of the
ZnO:Al layers in the relevant region for CIGS, as is described in the ‘Optical properties’
chapter. However the absorption at wavelengths above 1600-1700 nm increases with
time, while the reflection decreases. This indicates that these spots and stains absorb
near-infrared light.
(a) (b)
Figure 6.5
o
(a) Optical microscope picture of the surface of the RT sample after 2182 hours exposure to 85 C/85% RH
o
(b) Backscattered SEM image of the RT sample after 2344 hours exposure at 85 C/85% RH.
185
process. Oxygen has a small atomic diameter and creates interstitial alloys with many
materials, which can expand the lattice structure.
Furthermore, the (002) and (004) lines are asymmetric, which is somewhat unusual. This
asymmetry can be caused by presence of a second phase with a different structure or
composition. It is suggested that this effect is observed when the substrate is located
directly below the erosive zone of the target in magnetron sputtering unit, where
the concentration of negative oxygen ions is the highest. Those ions are accelerated
on the substrate and are implanted into the film and occupy the interstitial positions.
This asymmetry effect could probably be countered by post-deposition heating, but
this is probably not possible for CIGS cells, which cannot stand temperatures above
o
approximately 200 C.
After degradation, the number and general position of the orientation did not change,
which indicated that structural properties were constant. The position and intensity
changed slightly but this change is within the measurement variation of the XRD.
6.3.1.2 Surface evaluation
While measurements by HIM did not show large differences in appearance due to
degradation, the SEM and microscope revealed the occurrence of small dots and
larger stains on the surface. The size and quantity of these spots increased with time,
as is shown on the microscope photos in Figure 6.5a. After approximately 2000 hours,
the circle-like dots have diameters up to 100 micrometres, while the stains, with less
defined shapes, have diameters up to 1 mm. After 2182 hours, these dots and stains
cover approximately 6±1% of the surface, but do not influence the transmission of the
ZnO:Al layers in the relevant region for CIGS, as is described in the ‘Optical properties’
chapter. However the absorption at wavelengths above 1600-1700 nm increases with
time, while the reflection decreases. This indicates that these spots and stains absorb
near-infrared light.
(a) (b)
Figure 6.5
o
(a) Optical microscope picture of the surface of the RT sample after 2182 hours exposure to 85 C/85% RH
o
(b) Backscattered SEM image of the RT sample after 2344 hours exposure at 85 C/85% RH.
185