Page 221 - Mirjam-Theelen-Degradation-of-CIGS-solar-cells
P. 221
The impact of alkali elements
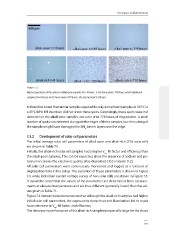
Figure 7.3
Microscopy picture of the surface of alkali-poor samples at t=0 hours, t=165 hours and t=778 hours, and of alkali-rich
samples at t=0 hours, t=165 hours and t=778 hours. The size bar depicts 500 µm.
It should be noted that similar samples exposed to only damp heat (samples at 105 o C in
o
a 85 C/85% RH chamber) did not show these spots. Surprisingly, these spots were not
detected on the alkali-poor samples, not even after 778 hours of degradation. A small
number of spots was detected alongside the edges of these samples, but the cutting of
the samples might have damaged the SiN barrier layers near the edge.
x
7.3.2 Development of solar cell parameters
The initial average solar cell parameters of alkali-poor and alkali-rich CIGS solar cells
are shown in Table 7.1 .
Initially, the alkali-rich solar cell samples had a higher V fill factor and efficiency than
oc,
the alkali-poor samples. This can be expected, since the presence of sodium and po-
tassium increases the electronic quality of as-deposited CIGS material [1,2].
All solar cell parameters were continuously monitored and logged as a function of
degradation time in the setup. The evolution of these parameters is shown in Figure
7. 4, while individual current voltage curves of two solar cells are shown in Figure 7.5.
It should be noted that the values of the parameters are determined from measure-
ments at elevated temperatures and are thus different (generally lower) than the val-
ues given in Table 7.1 .
Figure 7.4 demonstrates demonstrate that although the alkali-rich samples had higher
initial solar cell parameters, the exposure to damp heat and illumination led to much
faster decrease in V , fill factor and efficiency.
oc
The decrease in performance of the alkali-rich samples is especially large for the shunt
219