Page 223 - Mirjam-Theelen-Degradation-of-CIGS-solar-cells
P. 223
The impact of alkali elements
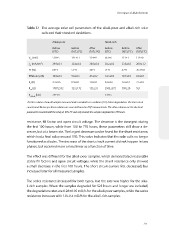
Table 7.1 The average solar cell parameters of the alkali-poor and alkali-rich solar
cells and their standard deviations.
Alkali-poor Alkali-rich
Before Before After Before Before After
(STC) (107±1 °C) (107±1 C) (STC) (107±1 °C) (107±1 °C)
o
V oc (mV) 528±5 331±11 324±9 667±6 513±1 173±0
J sc (mA/cm ) 29.9±0.1 32.6±0.4 30.0±0.4 30.2±0.2 33.8±0.3 20.9±1.2
2
FF (%) 63±2 52±2 46±1 71±1 62±1 26.3±0.1
Efficiency (%) 10.0±0.3 5.6±0.3 4.5±0.2 14.3±0.3 10.7±0.3 0.9±0.1
R s (Ω) 4.3±0.6 0.9±0.1 1.0±0.1 4.6±0.6 1.6±0.4 2.5±0.5
R sh (Ω) 1787±532 323±172 135±23 2505±372 399±20 9±1
R sh dark (kΩ) 74±19 23±15
The first columns show all samples measured under standard test conditions (STC) before degradation. The short circuit
current and efficiency in these columns are corrected based on EQE measurements. The other columns are the electrical
o
parameters recorded with the setup at 107±1 C and only include the samples degraded for 778 hours.
resistance, fill factor and open circuit voltage. The decrease is the strongest during
the first 100 hours, while from 100 to 778 hours, these parameters still show a de-
crease, but at a lower rate. The largest decrease can be found for the shunt resistance,
which had a final value around 10Ω. This value indicates that the solar cells no longer
functioned as diodes. The decrease of the short circuit current did not happen in two
phases, but occurred more or less linear as a function of time.
The effect was different for the alkali-poor samples, which demonstrated reasonable
stable fill factors and open circuit voltages, while the shunt resistance only showed
a small decrease in the first 100 hours. The short circuit current first decreased, but
increased later for all measured samples.
The series resistance increased for both types, but the rate was higher for the alka-
li-rich samples. When the samples degraded for 525 hours and longer are included,
the degradation rates are 0.28±0.05 mΩ/h for the alkali-poor samples, while the series
resistance increases with 1.0±0.4 mΩ/h for the alkali-rich samples.
221