Page 222 - Mirjam-Theelen-Degradation-of-CIGS-solar-cells
P. 222
Chapter 7
0.6 40
(a) Alkali-rich 35 Alkali-poor (b)
Open circuit voltage (V) 0.4 Alkali-poor Short circuit current density mA/(cm 2 ) 30
25
0.2
0 200 400 600 20 0 200 400 Alkali-rich
600
Time in setup (hours) Time in setup (hours)
(c) 70 12 (d)
60 Alkali-poor 10 8 Alkali-rich
Fill Factor (%) 50 Alkali-rich Efficiency (%) 6 4 Alkali-poor
40
30
20 2 0
0 200 400 600 0 200 400 600
(e) Time in setup (hours) Time in setup (hours) (f)
1000 3
Shunt resistance () 100 Alkali-poor Series resistance () 2 1 Alkali-rich
10 Alkali-rich Alkali-poor
0
0 200 400 600 0 200 400 600
Figure 7.4 Time in setup (hours) Time in setup (hours)
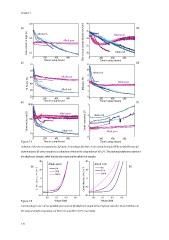
Evolution of the electrical parameters (a) Open circuit voltage (b) short circuit current density (c) fill factor (d) efficiency (e)
o
shunt resistance (f) series resistances as a function of time in the setup taken at 107±1 C. The pink and purple lines represent
the alkali-poor samples, while the blue lines represent the alkali-rich samples.
40 40
Alkali-poor Alkali-rich
(a) 2 ) 20 0 h 20 0 h (b)
Current density (mA/cm -20 0 500 h Current density (mA/cm 2 ) -20 0 500 h
50 h
50 h
-40 -40
0.0 0.2 0.4 0.6 0.0 0.2 0.4 0.6
Figure 7.5 Voltage (Volt) Voltage (Volt)
Current voltage curves of one (a) alkali-poor and one (b) alkali-rich sample before exposure and after 50 and 500 hours in
the setup at sample temperatures of 105.0±0.5 and 106.9±0.5 C respectively.
o
220
0.6 40
(a) Alkali-rich 35 Alkali-poor (b)
Open circuit voltage (V) 0.4 Alkali-poor Short circuit current density mA/(cm 2 ) 30
25
0.2
0 200 400 600 20 0 200 400 Alkali-rich
600
Time in setup (hours) Time in setup (hours)
(c) 70 12 (d)
60 Alkali-poor 10 8 Alkali-rich
Fill Factor (%) 50 Alkali-rich Efficiency (%) 6 4 Alkali-poor
40
30
20 2 0
0 200 400 600 0 200 400 600
(e) Time in setup (hours) Time in setup (hours) (f)
1000 3
Shunt resistance () 100 Alkali-poor Series resistance () 2 1 Alkali-rich
10 Alkali-rich Alkali-poor
0
0 200 400 600 0 200 400 600
Figure 7.4 Time in setup (hours) Time in setup (hours)
Evolution of the electrical parameters (a) Open circuit voltage (b) short circuit current density (c) fill factor (d) efficiency (e)
o
shunt resistance (f) series resistances as a function of time in the setup taken at 107±1 C. The pink and purple lines represent
the alkali-poor samples, while the blue lines represent the alkali-rich samples.
40 40
Alkali-poor Alkali-rich
(a) 2 ) 20 0 h 20 0 h (b)
Current density (mA/cm -20 0 500 h Current density (mA/cm 2 ) -20 0 500 h
50 h
50 h
-40 -40
0.0 0.2 0.4 0.6 0.0 0.2 0.4 0.6
Figure 7.5 Voltage (Volt) Voltage (Volt)
Current voltage curves of one (a) alkali-poor and one (b) alkali-rich sample before exposure and after 50 and 500 hours in
the setup at sample temperatures of 105.0±0.5 and 106.9±0.5 C respectively.
o
220