Page 224 - Mirjam-Theelen-Degradation-of-CIGS-solar-cells
P. 224
Chapter 7
100 100
(a) 80 Alkali-poor 0 h 80 Alkali-rich 0 h (b)
165 h
165 h
External Quantum Efficiency (%) 60 525 h External Quantum Efficiency (%) 60 778 h
365 h
365 h
525 h
778 h
40
40
20
20
0
400 600 800 1000 1200 0 400 600 800 1000 1200
Wavelength (nm) Wavelength (nm)
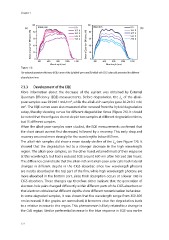
Figure 7.6:
The external quantum efficiency (EQE) curve of the (a) alkali-poor and (b) alkali-rich CIGS solar cells presented for different
degradation times
7.3.3 Development of the EQE
More information about the decrease of the current was obtained by External
Quantum Efficiency (EQE) measurements. Before degradation, the J of the alkali-
sc
poor samples was 29.9±0.1 mA/cm , while the alkali-rich samples gave 30.2±0.2 mA/
2
2
cm . The EQE curves were also measured after removal from the hybrid degradation
setup, thereby showing curves for different degradation times (Figure 7.6). It should
be noted that these figures do not depict two samples at different degradation times,
but 15 different samples.
When the alkali-poor samples were studied, the EQE measurements confirmed that
the short circuit current first decreased, followed by a recovery. This early drop and
recovery occurred more strongly for the wavelengths below 850 nm.
The alkali-rich samples did show a more steady decline of the J(see Figure 7.4). It
sc
showed that the degradation led to a stronger decrease in the high wavelength
region. The alkali-poor samples, on the other hand, retained most of their response
at this wavelength, but had a reduced EQE around 600 nm after 165 and 365 hours.
This difference can indicate that the alkali-rich and alkali-poor solar cells had material
changes in different depths in the CIGS absorber, since low wavelength photons
are mostly absorbed in the top part of the film, while high wavelength photons are
more absorbed in the bottom part, since their absorption occurs at a lower rate in
CIGS absorbers. These changes can therefore either indicate that the generation of
electron-hole pairs changed differently within different parts of the CIGS absorbers or
that electrons obtained at different depths show different recombination behaviour.
In some degraded samples, it was shown that the wavelength range from 350-500
nm increased. If the graphs are normalised, it becomes clear the degradation leads
to a relative increase in this region. This phenomenon is likely related to a change in
the CdS region. Similar preferential increase in the blue response in EQE was earlier
222
100 100
(a) 80 Alkali-poor 0 h 80 Alkali-rich 0 h (b)
165 h
165 h
External Quantum Efficiency (%) 60 525 h External Quantum Efficiency (%) 60 778 h
365 h
365 h
525 h
778 h
40
40
20
20
0
400 600 800 1000 1200 0 400 600 800 1000 1200
Wavelength (nm) Wavelength (nm)
Figure 7.6:
The external quantum efficiency (EQE) curve of the (a) alkali-poor and (b) alkali-rich CIGS solar cells presented for different
degradation times
7.3.3 Development of the EQE
More information about the decrease of the current was obtained by External
Quantum Efficiency (EQE) measurements. Before degradation, the J of the alkali-
sc
poor samples was 29.9±0.1 mA/cm , while the alkali-rich samples gave 30.2±0.2 mA/
2
2
cm . The EQE curves were also measured after removal from the hybrid degradation
setup, thereby showing curves for different degradation times (Figure 7.6). It should
be noted that these figures do not depict two samples at different degradation times,
but 15 different samples.
When the alkali-poor samples were studied, the EQE measurements confirmed that
the short circuit current first decreased, followed by a recovery. This early drop and
recovery occurred more strongly for the wavelengths below 850 nm.
The alkali-rich samples did show a more steady decline of the J(see Figure 7.4). It
sc
showed that the degradation led to a stronger decrease in the high wavelength
region. The alkali-poor samples, on the other hand, retained most of their response
at this wavelength, but had a reduced EQE around 600 nm after 165 and 365 hours.
This difference can indicate that the alkali-rich and alkali-poor solar cells had material
changes in different depths in the CIGS absorber, since low wavelength photons
are mostly absorbed in the top part of the film, while high wavelength photons are
more absorbed in the bottom part, since their absorption occurs at a lower rate in
CIGS absorbers. These changes can therefore either indicate that the generation of
electron-hole pairs changed differently within different parts of the CIGS absorbers or
that electrons obtained at different depths show different recombination behaviour.
In some degraded samples, it was shown that the wavelength range from 350-500
nm increased. If the graphs are normalised, it becomes clear the degradation leads
to a relative increase in this region. This phenomenon is likely related to a change in
the CdS region. Similar preferential increase in the blue response in EQE was earlier
222