Page 230 - Mirjam-Theelen-Degradation-of-CIGS-solar-cells
P. 230
Chapter 7
(a) 10 6 Alkali-poor (b) 10 6 Alkali-rich
O O Na
10 5 In Mo 10 5 Zn In Mo
Intensity (counts) 10 4 3 Zn Na Intensity (counts) 10 4 3 K
K
10
10
10 2 OH Cd 10 2 OH Cd
0 1000 2000 3000 0 1000 2000 3000 4000
Sputtering time (seconds) Sputtering time (seconds)
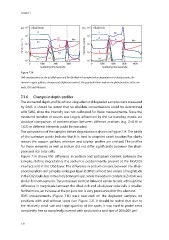
Figure 7.14
SIMS measurements on the (a) alkali-poor and the (b) alkali-rich samples before degradation. For clarity reasons, the
elements copper, gallium, selenium and sulphur are omitted. The gray dashed lines indicate the global positions of the zinc
oxide, CIGS and Mo layers.
7.3.6 Changes in depth-profiles
The elemental depth profiles of non-degraded and degraded samples were measured
by SIMS. It should be noted that no absolute concentrations could be determined
with SIMS, since the intensity was not calibrated for these measurements. Since the
measured number of counts was largely influenced by the surrounding matrix, no
absolute comparison of concentrations between different matrices (e.g. ZnO:Al or
CIGS) or different elements could be executed.
The composition of the samples before degradation is shown in Figure 7.14. The width
of the cadmium peaks indicate that it is hard to pinpoint exact location For clarity
reason, the copper, gallium, selenium and sulphur profiles are omitted. The profiles
for these elements as well as indium did not differ significantly between the alkali-
poor and rich solar cells.
Figure 7.14 shows the difference in sodium and potassium content between the
samples. Before degradation, the sodium is predominantly present at the Mo/CIGS
interface and in the CIGS layer. The difference in sodium content between the alkali-
poor and alkali-rich samples varies per layer: it differs almost two orders of magnitude
in the CIGS bulk, less in the molybdenum layer, while the sodium content in ZnO:Al was
similar for both samples. The potassium content followed similar trends, although the
difference in magnitude between the alkali-rich and alkali-poor solar cells is smaller.
Furthermore, an increase at the pn-junction is very pronounced for this element.
SIMS measurements (Figure 7.15) were executed on the degraded samples, on
positions with and without spots (see Figure 7.2). It should be noted that due to
the relatively small size and large quantity of the spots, it was hard to probe areas
2
completely free or completely covered with spots with a spot size of 200x200 μm .
228
(a) 10 6 Alkali-poor (b) 10 6 Alkali-rich
O O Na
10 5 In Mo 10 5 Zn In Mo
Intensity (counts) 10 4 3 Zn Na Intensity (counts) 10 4 3 K
K
10
10
10 2 OH Cd 10 2 OH Cd
0 1000 2000 3000 0 1000 2000 3000 4000
Sputtering time (seconds) Sputtering time (seconds)
Figure 7.14
SIMS measurements on the (a) alkali-poor and the (b) alkali-rich samples before degradation. For clarity reasons, the
elements copper, gallium, selenium and sulphur are omitted. The gray dashed lines indicate the global positions of the zinc
oxide, CIGS and Mo layers.
7.3.6 Changes in depth-profiles
The elemental depth profiles of non-degraded and degraded samples were measured
by SIMS. It should be noted that no absolute concentrations could be determined
with SIMS, since the intensity was not calibrated for these measurements. Since the
measured number of counts was largely influenced by the surrounding matrix, no
absolute comparison of concentrations between different matrices (e.g. ZnO:Al or
CIGS) or different elements could be executed.
The composition of the samples before degradation is shown in Figure 7.14. The width
of the cadmium peaks indicate that it is hard to pinpoint exact location For clarity
reason, the copper, gallium, selenium and sulphur profiles are omitted. The profiles
for these elements as well as indium did not differ significantly between the alkali-
poor and rich solar cells.
Figure 7.14 shows the difference in sodium and potassium content between the
samples. Before degradation, the sodium is predominantly present at the Mo/CIGS
interface and in the CIGS layer. The difference in sodium content between the alkali-
poor and alkali-rich samples varies per layer: it differs almost two orders of magnitude
in the CIGS bulk, less in the molybdenum layer, while the sodium content in ZnO:Al was
similar for both samples. The potassium content followed similar trends, although the
difference in magnitude between the alkali-rich and alkali-poor solar cells is smaller.
Furthermore, an increase at the pn-junction is very pronounced for this element.
SIMS measurements (Figure 7.15) were executed on the degraded samples, on
positions with and without spots (see Figure 7.2). It should be noted that due to
the relatively small size and large quantity of the spots, it was hard to probe areas
2
completely free or completely covered with spots with a spot size of 200x200 μm .
228