Page 227 - Mirjam-Theelen-Degradation-of-CIGS-solar-cells
P. 227
The impact of alkali elements
200 Non-degraded 200 Non-degraded
Current density (mA/cm 2 ) 100 Darkness 300K Current density (mA/cm 2 ) 100 Darkness 300K
Alkali-poor
Alkali-rich
150
150
50
50
106K
0
0 500 1000 Voltage (mV) 0 0 500 1000 106K
-50 -50 Voltage (mV)
200 165 h degraded 200 165 h degraded
Current density (mA/cm 2 ) 100 Darkness 300K Current density (mA/cm 2 ) 100 289K
Alkali -rich
Alkali-poor
150
150
Darkness
50
50
0
0 500 1000 106K 0 0 500 Voltage (mV) 1000 106K
-50 Voltage (mV) -50 260K and 270K missing
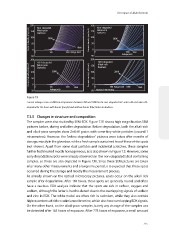
Figure 7.9
Current-voltage curves at different temperatures between 100 and 300K for the non-degraded CIGS solar cells and solar cells
degraded for 165 hours with barrier (purple) and without barrier (blue) taken in darkness.
7.3.5 Changes in structure and composition
The samples were also studied by SEM-EDX. Figure 7.10 shows high magnification SEM
pictures before, during and after degradation. Before degradation, both the alkali-rich
and alkali-poor samples show ZnO:Al grains with some tiny white particles (around 1
micrometres). However, the ‘before degradation’ pictures were taken after months of
storage, mostly in the glovebox, while a fresh sample contained less of these white spots
(not shown). Apart from some dust particles and incidental scratches, these samples
further both looked mostly homogeneous, as is also shown in Figure 7. 3. However, some
early degradation spots were already observed on the non-degraded alkali containing
samples, so these are also depicted in Figure 7.10. Since these SEM pictures are taken
after many other measurements and a long time period, it is expected that these spots
occurred during the storage and mostly the measurement process.
As already shown on the optical microscopy pictures, spots occur on the alkali-rich
sample after degradation. After 165 hours, these spots are generally round, and often
have a nucleus. EDX analysis indicate that the spots are rich in carbon, oxygen and
sodium, although the latter is hard to detect due to the overlapping signals of sodium
and zinc in EDX. The white nuclei are often rich in cadmium, while they also contain
higher contents of either cadmium or bromine, which also have overlapping EDX signals.
On the other hand, on the alkali-poor samples, barely any change of the samples can
be detected after 165 hours of exposure. After 778 hours of exposure, a small amount
225
200 Non-degraded 200 Non-degraded
Current density (mA/cm 2 ) 100 Darkness 300K Current density (mA/cm 2 ) 100 Darkness 300K
Alkali-poor
Alkali-rich
150
150
50
50
106K
0
0 500 1000 Voltage (mV) 0 0 500 1000 106K
-50 -50 Voltage (mV)
200 165 h degraded 200 165 h degraded
Current density (mA/cm 2 ) 100 Darkness 300K Current density (mA/cm 2 ) 100 289K
Alkali -rich
Alkali-poor
150
150
Darkness
50
50
0
0 500 1000 106K 0 0 500 Voltage (mV) 1000 106K
-50 Voltage (mV) -50 260K and 270K missing
Figure 7.9
Current-voltage curves at different temperatures between 100 and 300K for the non-degraded CIGS solar cells and solar cells
degraded for 165 hours with barrier (purple) and without barrier (blue) taken in darkness.
7.3.5 Changes in structure and composition
The samples were also studied by SEM-EDX. Figure 7.10 shows high magnification SEM
pictures before, during and after degradation. Before degradation, both the alkali-rich
and alkali-poor samples show ZnO:Al grains with some tiny white particles (around 1
micrometres). However, the ‘before degradation’ pictures were taken after months of
storage, mostly in the glovebox, while a fresh sample contained less of these white spots
(not shown). Apart from some dust particles and incidental scratches, these samples
further both looked mostly homogeneous, as is also shown in Figure 7. 3. However, some
early degradation spots were already observed on the non-degraded alkali containing
samples, so these are also depicted in Figure 7.10. Since these SEM pictures are taken
after many other measurements and a long time period, it is expected that these spots
occurred during the storage and mostly the measurement process.
As already shown on the optical microscopy pictures, spots occur on the alkali-rich
sample after degradation. After 165 hours, these spots are generally round, and often
have a nucleus. EDX analysis indicate that the spots are rich in carbon, oxygen and
sodium, although the latter is hard to detect due to the overlapping signals of sodium
and zinc in EDX. The white nuclei are often rich in cadmium, while they also contain
higher contents of either cadmium or bromine, which also have overlapping EDX signals.
On the other hand, on the alkali-poor samples, barely any change of the samples can
be detected after 165 hours of exposure. After 778 hours of exposure, a small amount
225