Page 231 - Mirjam-Theelen-Degradation-of-CIGS-solar-cells
P. 231
The impact of alkali elements
Alkali-poor Alkali-rich
10 4
(a) 10 3 ZnO:Al CIGS Mo (b)
10 2
10 1
OH OH
Intensity (counts) 10 4 3 Intensity (counts) 10 4 3 K
10
10
ZnO:Al CIGS Mo K
10 5 10 5
10 3 Na 10 3 Na
0 1000 2000 3000 0 1000 2000 3000 4000
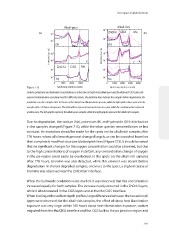
Figure 7.15 Sputtering depth (seconds) Sputtering depth (seconds)
Sodium, potassium and hydroxide concentrations as a function of depth in (a) alkali-poor and (b) alkali-rich CIGS solar cells
exposed to illumination and damp heat for different periods. The dark blue lines indicate the samples before degradation, the
purple lines are the samples after 165 hours of the damp heat illumination exposure, while the light pink colours represent the
samples after 778 hours of exposure. The dotted lines represent measurements on a spot, while the continuous line represent
spotless area. The left graphs represent the alkali-poor samples, while the right graphs represent the alkali-rich samples.
Due to degradation, the sodium (Na), potassium (K) and hydroxide (OH) distribution
in the samples changed (Figure 7.15), while the other species remained more or less
constant. An exception should be made for the spots on the alkali-rich samples after
778 hours, where all elements present changed largely, as can be expected based on
their completely modified structure (dotted pink lines) ( Figure 7.13). It should be noted
that no significant changes for the oxygen concentration could be observed, but due
to the high concentrations of oxygen in ZnO:Al, any concentration change of oxygen
in the pn-region could easily be overlooked. In the spots on the alkali-rich samples
after 778 hours, bromine was also detected, while this element was absent before
degradation. In shorter degraded samples, and next to the spots, a slight increase of
bromine was observed near the ZnO:Al/air interface.
When the hydroxide evolutions were studied, it was observed that this concentration
increased equally for both samples. The increase mainly occurred in the ZnO:Al layers,
while it also increased in the CIGS layers and at the Mo/CIGS interface.
When looking at the sodium depth profiles, large differences between the two solar cell
types were observed: for the alkali-rich samples, the effect of damp heat illumination
exposure was very large: within 165 hours damp heat-illumination exposure, sodium
migrated from the Mo/CIGS interface and the CIGS bulk to the pn junction region and
229
Alkali-poor Alkali-rich
10 4
(a) 10 3 ZnO:Al CIGS Mo (b)
10 2
10 1
OH OH
Intensity (counts) 10 4 3 Intensity (counts) 10 4 3 K
10
10
ZnO:Al CIGS Mo K
10 5 10 5
10 3 Na 10 3 Na
0 1000 2000 3000 0 1000 2000 3000 4000
Figure 7.15 Sputtering depth (seconds) Sputtering depth (seconds)
Sodium, potassium and hydroxide concentrations as a function of depth in (a) alkali-poor and (b) alkali-rich CIGS solar cells
exposed to illumination and damp heat for different periods. The dark blue lines indicate the samples before degradation, the
purple lines are the samples after 165 hours of the damp heat illumination exposure, while the light pink colours represent the
samples after 778 hours of exposure. The dotted lines represent measurements on a spot, while the continuous line represent
spotless area. The left graphs represent the alkali-poor samples, while the right graphs represent the alkali-rich samples.
Due to degradation, the sodium (Na), potassium (K) and hydroxide (OH) distribution
in the samples changed (Figure 7.15), while the other species remained more or less
constant. An exception should be made for the spots on the alkali-rich samples after
778 hours, where all elements present changed largely, as can be expected based on
their completely modified structure (dotted pink lines) ( Figure 7.13). It should be noted
that no significant changes for the oxygen concentration could be observed, but due
to the high concentrations of oxygen in ZnO:Al, any concentration change of oxygen
in the pn-region could easily be overlooked. In the spots on the alkali-rich samples
after 778 hours, bromine was also detected, while this element was absent before
degradation. In shorter degraded samples, and next to the spots, a slight increase of
bromine was observed near the ZnO:Al/air interface.
When the hydroxide evolutions were studied, it was observed that this concentration
increased equally for both samples. The increase mainly occurred in the ZnO:Al layers,
while it also increased in the CIGS layers and at the Mo/CIGS interface.
When looking at the sodium depth profiles, large differences between the two solar cell
types were observed: for the alkali-rich samples, the effect of damp heat illumination
exposure was very large: within 165 hours damp heat-illumination exposure, sodium
migrated from the Mo/CIGS interface and the CIGS bulk to the pn junction region and
229