Page 155 - Mirjam-Theelen-Degradation-of-CIGS-solar-cells
P. 155
Degradation mechanisms of the molybdenum back contact
100 μm 50 μm
Figure 5.21
o
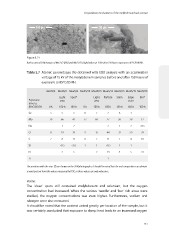
Backscattered SEM images of Mo25/2 (left) and Mo25/15 (right) taken at 15 kV after 150 hours exposure to 85 C/85% RH.
Table 5.7 Atomic percentages (%) obtained with EDX analysis with an acceleration
voltage of 15 kV of the molybdenum samples before and after 150 hours of
o
exposure to 85 C/85 RH.
Mo25/2 Mo25/2 Mo25/2 Mo25/15 Mo25/15 Mo25/15 Mo25/15 Mo25/15 Mo25/15
Light Spot* Light Particle Stain Edge Bar*
Exposure area area stain
time to
85 C/85 RH 0h 150 h 150 h 0 h 150 h 150 h 150 h 150 h 150 h
o
Se 5 5 3 8 7 2 6 1
Mo 79 66 41 77 69 27 50 28 12
Na 1 2 2 1 2 <0.5
O 8 19 39 9 15 44 32 59 39
C 7 8 11 6 7 11 7 4 18
Si <0.5 <0.5 1 1 <0.5 1 1
N 2 5 2 14 4 5 31
Ti 1
The positions with the stars (*) are shown on the SEM photographs. It should be noted that the real composition can deviate
several percent from the values measured by EDX, so these values are only indicative.
stains.
The ‘clean’ spots still contained molybdenum and selenium, but the oxygen
concentration had increased. When the various ‘needle’ and ‘bar’ rich areas were
studied, the oxygen concentrations was even higher. Furthermore, sodium and
nitrogen were also measured.
It should be noted that the content varied greatly per location of the sample, but it
was certainly concluded that exposure to damp heat leads to an increased oxygen
153
100 μm 50 μm
Figure 5.21
o
Backscattered SEM images of Mo25/2 (left) and Mo25/15 (right) taken at 15 kV after 150 hours exposure to 85 C/85% RH.
Table 5.7 Atomic percentages (%) obtained with EDX analysis with an acceleration
voltage of 15 kV of the molybdenum samples before and after 150 hours of
o
exposure to 85 C/85 RH.
Mo25/2 Mo25/2 Mo25/2 Mo25/15 Mo25/15 Mo25/15 Mo25/15 Mo25/15 Mo25/15
Light Spot* Light Particle Stain Edge Bar*
Exposure area area stain
time to
85 C/85 RH 0h 150 h 150 h 0 h 150 h 150 h 150 h 150 h 150 h
o
Se 5 5 3 8 7 2 6 1
Mo 79 66 41 77 69 27 50 28 12
Na 1 2 2 1 2 <0.5
O 8 19 39 9 15 44 32 59 39
C 7 8 11 6 7 11 7 4 18
Si <0.5 <0.5 1 1 <0.5 1 1
N 2 5 2 14 4 5 31
Ti 1
The positions with the stars (*) are shown on the SEM photographs. It should be noted that the real composition can deviate
several percent from the values measured by EDX, so these values are only indicative.
stains.
The ‘clean’ spots still contained molybdenum and selenium, but the oxygen
concentration had increased. When the various ‘needle’ and ‘bar’ rich areas were
studied, the oxygen concentrations was even higher. Furthermore, sodium and
nitrogen were also measured.
It should be noted that the content varied greatly per location of the sample, but it
was certainly concluded that exposure to damp heat leads to an increased oxygen
153