Page 200 - Mirjam-Theelen-Degradation-of-CIGS-solar-cells
P. 200
Chapter 6
6.3.4 Compositional changes
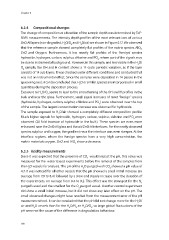
The change of composition as a function of the sample depth was determined by ToF-
SIMS measurements. The intensity depth profiles of the most relevant ions of various
ZnO:Al layers (non-degraded, H O/O and H O/air) are shown in Figure 6.17. We observed
2
2
2
that the reference sample showed completely flat profiles of the matrix species AlO,
3
ZnO and Oxygen. Furthermore, it has mostly flat profiles of the ‘foreign’ species
hydroxide, hydrogen, carbon, sulphur, chlorine and PO , where part of the signals may
x
be due to instrumental background. However, in this sample, and less visible in the H 2 O/
O sample, the OH and H content shows a 14-cycle periodic variation, as if the layer
2
consists of 14 sub-layers. It was checked under different conditions and concluded that
was not an instrumental effect. Since the samples were deposited in 14 passes in the
sputtering tool, it can be concluded that H O or similar species are incorporated in small
2
quantities during the deposition process.
Exposure to H O/O seems to lead to the smoothening of the OH and H profiles in the
2
2
bulk and near the glass. Furthermore, small signal increases of most ‘foreign’ species
(hydroxide, hydrogen, carbon, sulphur, chlorine and PO ) were observed near the top
x
of the sample. The largest concentration increase was observed for hydroxide.
The sample exposed to HO/air showed a completely different composition profile:
2
Much higher signals for hydroxide, hydrogen, carbon, sulphur, chlorine and PO were
x
observed (20 fold increase of hydroxide in the bulk). These species are even more
enhanced near the ZnO:Al/glass and the air/ZnO:Al interfaces. For the newly observed
species sulphur and copper, the gradient near the interface was even steeper. At the
interface regions, where the foreign species have a very high concentration, the
matrix materials oxygen, ZnO and AlO show a decrease.
3
6.3.5 Acidity measurements
Since it was expected that the presence of CO would impact the pH, this value was
2
measured for the water based experiments before the removal of the samples from
the H O vessels for analysis. The pH of the H O purged with CO showed a pH value of
2
2
2
4.7. It was noticed for all other vessels that the pH showed a small initial increase (an
average from 7.9 to 8.4) followed by a slow and steady increase over the duration of
the experiments, on average from 8.4 to 9.2. This effect was the strongest for the N
2
purged vessel and the smallest for the O purged vessel. Another control experiment
2
did show a small initial increase, but it did not show any later effect on the pH. The
small observed changes might have resulted from the measurement error of the pH
measurement tool. It can be concluded that the pH did not change more for the H O/
2
air and H O vessels than for the HO/N an H O/O , so large global fluctuations of the
2
2
2
2
2
pH were not the cause of the difference in degradation behaviour.
198
6.3.4 Compositional changes
The change of composition as a function of the sample depth was determined by ToF-
SIMS measurements. The intensity depth profiles of the most relevant ions of various
ZnO:Al layers (non-degraded, H O/O and H O/air) are shown in Figure 6.17. We observed
2
2
2
that the reference sample showed completely flat profiles of the matrix species AlO,
3
ZnO and Oxygen. Furthermore, it has mostly flat profiles of the ‘foreign’ species
hydroxide, hydrogen, carbon, sulphur, chlorine and PO , where part of the signals may
x
be due to instrumental background. However, in this sample, and less visible in the H 2 O/
O sample, the OH and H content shows a 14-cycle periodic variation, as if the layer
2
consists of 14 sub-layers. It was checked under different conditions and concluded that
was not an instrumental effect. Since the samples were deposited in 14 passes in the
sputtering tool, it can be concluded that H O or similar species are incorporated in small
2
quantities during the deposition process.
Exposure to H O/O seems to lead to the smoothening of the OH and H profiles in the
2
2
bulk and near the glass. Furthermore, small signal increases of most ‘foreign’ species
(hydroxide, hydrogen, carbon, sulphur, chlorine and PO ) were observed near the top
x
of the sample. The largest concentration increase was observed for hydroxide.
The sample exposed to HO/air showed a completely different composition profile:
2
Much higher signals for hydroxide, hydrogen, carbon, sulphur, chlorine and PO were
x
observed (20 fold increase of hydroxide in the bulk). These species are even more
enhanced near the ZnO:Al/glass and the air/ZnO:Al interfaces. For the newly observed
species sulphur and copper, the gradient near the interface was even steeper. At the
interface regions, where the foreign species have a very high concentration, the
matrix materials oxygen, ZnO and AlO show a decrease.
3
6.3.5 Acidity measurements
Since it was expected that the presence of CO would impact the pH, this value was
2
measured for the water based experiments before the removal of the samples from
the H O vessels for analysis. The pH of the H O purged with CO showed a pH value of
2
2
2
4.7. It was noticed for all other vessels that the pH showed a small initial increase (an
average from 7.9 to 8.4) followed by a slow and steady increase over the duration of
the experiments, on average from 8.4 to 9.2. This effect was the strongest for the N
2
purged vessel and the smallest for the O purged vessel. Another control experiment
2
did show a small initial increase, but it did not show any later effect on the pH. The
small observed changes might have resulted from the measurement error of the pH
measurement tool. It can be concluded that the pH did not change more for the H O/
2
air and H O vessels than for the HO/N an H O/O , so large global fluctuations of the
2
2
2
2
2
pH were not the cause of the difference in degradation behaviour.
198