Page 196 - Mirjam-Theelen-Degradation-of-CIGS-solar-cells
P. 196
Chapter 6
6.3.2 Atmospheric species treatment
6.3.2.1 Structural properties
From cross section HIM and SEM pictures, it was concluded that the non-degraded
ZnO:Al layer has a columnar structure and a thickness of 480-520 nm. It was observed
that the structure of the columns was not completely straight, but showed a wavy
structure. This wavy structure can be caused by the movement of the substrate during
deposition on the semi-industrial tool, which slowly moves the substrate back and
forth during the deposition.
During degradation, the most striking observation was complete dissolution of the
sample that was placed in H O purged with CO , which occurred within hours. No further
2
2
results of this sample are therefore given in this article. The other samples did not dissolve
and their compositional, optical and electrical properties were followed for 310 hours.
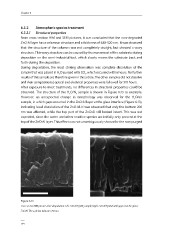
After exposure to most treatments, no differences in structural properties could be
observed. The structure of the HO/N sample is shown in Figure 6.13 as example.
2
2
However, an unexpected change in morphology was observed for the HO/air
2
sample, in which gaps occurred in the ZnO:Al layer at the glass interface (Figure 6.13),
indicating local dissolution of the ZnO:Al. It was observed that only the bottom 200
nm was affected, while the top part of the ZnO:Al still looked intact. This was not
expected, since the water and other reactive species are initially only present at the
top of the ZnO:Al layer. This effect was not unambiguously shown for the non-purged
Figure 6.13
Cross section HIM pictures after degradation: Left: ZnO:Al H 2 O/N 2 sample; Right: ZnO:Al H 2 O/air with gaps near the glass/
ZnO:Al. The scale bar indicates 250 nm.
194
6.3.2 Atmospheric species treatment
6.3.2.1 Structural properties
From cross section HIM and SEM pictures, it was concluded that the non-degraded
ZnO:Al layer has a columnar structure and a thickness of 480-520 nm. It was observed
that the structure of the columns was not completely straight, but showed a wavy
structure. This wavy structure can be caused by the movement of the substrate during
deposition on the semi-industrial tool, which slowly moves the substrate back and
forth during the deposition.
During degradation, the most striking observation was complete dissolution of the
sample that was placed in H O purged with CO , which occurred within hours. No further
2
2
results of this sample are therefore given in this article. The other samples did not dissolve
and their compositional, optical and electrical properties were followed for 310 hours.
After exposure to most treatments, no differences in structural properties could be
observed. The structure of the HO/N sample is shown in Figure 6.13 as example.
2
2
However, an unexpected change in morphology was observed for the HO/air
2
sample, in which gaps occurred in the ZnO:Al layer at the glass interface (Figure 6.13),
indicating local dissolution of the ZnO:Al. It was observed that only the bottom 200
nm was affected, while the top part of the ZnO:Al still looked intact. This was not
expected, since the water and other reactive species are initially only present at the
top of the ZnO:Al layer. This effect was not unambiguously shown for the non-purged
Figure 6.13
Cross section HIM pictures after degradation: Left: ZnO:Al H 2 O/N 2 sample; Right: ZnO:Al H 2 O/air with gaps near the glass/
ZnO:Al. The scale bar indicates 250 nm.
194