Page 197 - Mirjam-Theelen-Degradation-of-CIGS-solar-cells
P. 197
Degradation mechanisms of the aluminium doped zinc oxide front contact
H O, but probably also occurred.
2
When the samples were studied by eye or by light microscope, it was observed that
most samples did not look significantly different after degradation, although the H O/
2
air sample looked less homogeneous.
X-Ray Diffraction (XRD) measurements showed that the ZnO:Al samples before
degradation had a polycrystalline wurtzite structure and consisted of hexagonal
crystallites with a strong preferred orientation in the (002) directions along the c-axis
perpendicular to the substrate. The (004) orientation was also observed. Apart from the
dissolved sample exposed to H O/CO , the degradation neither led to the introduction of
2
2
any additional signals nor led to a significant change in position or shape of the signals.
Furthermore, the structural properties of the all the ZnO:Al samples did not change.
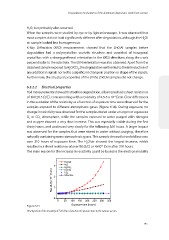
6.3.2.2 Electrical properties
Hall measurements showed that before degradation, all samples had a sheet resistance
-4
of 10.0±0.5 Ω/☐, corresponding with a resistivity of 4.5-5 x 10 Ωcm. Clear differences
in the evolution of the resistivity as a function of exposure time were observed for the
samples exposed to different atmospheric gases (Figure 6.14). During exposure, no
change in resistivity was observed for the samples stored under an argon or a gaseous
O or CO atmosphere, while the samples exposed to water purged with nitrogen
2
2
and oxygen showed a very slow increase. This was especially visible during the first
thirty hours, and continued very slowly for the following 300 hours. A larger impact
was observed for the samples that were stored in water without purging, therefore
naturally containing some atmospheric gases. This sample showed a twofold increase
over 210 hours of exposure time. The HO/air showed the largest increase, which
2
-3
resulted in a sheet resistance of over 80 Ω/☐ or 4x10 Ωcm after 310 hours.
The main reason for the increase in resistivity could be found in the electron mobility
H 2 O/air
3 H 2 O
H 2 O/O 2
-3 Ω cm) 2 H 2 O/N 2
CO 2
Glovebox
Resistivity (10 1
0
0 50 100 150 200 250 300 350
Figure 6.14 Exposure time (hours)
Development of the resistivity of ZnO:Al as a function of exposure time to the various species.
Figure 6.14: Development of the resistivity of ZnO:Al as a
function of exposure time to the various conditions
195
H O, but probably also occurred.
2
When the samples were studied by eye or by light microscope, it was observed that
most samples did not look significantly different after degradation, although the H O/
2
air sample looked less homogeneous.
X-Ray Diffraction (XRD) measurements showed that the ZnO:Al samples before
degradation had a polycrystalline wurtzite structure and consisted of hexagonal
crystallites with a strong preferred orientation in the (002) directions along the c-axis
perpendicular to the substrate. The (004) orientation was also observed. Apart from the
dissolved sample exposed to H O/CO , the degradation neither led to the introduction of
2
2
any additional signals nor led to a significant change in position or shape of the signals.
Furthermore, the structural properties of the all the ZnO:Al samples did not change.
6.3.2.2 Electrical properties
Hall measurements showed that before degradation, all samples had a sheet resistance
-4
of 10.0±0.5 Ω/☐, corresponding with a resistivity of 4.5-5 x 10 Ωcm. Clear differences
in the evolution of the resistivity as a function of exposure time were observed for the
samples exposed to different atmospheric gases (Figure 6.14). During exposure, no
change in resistivity was observed for the samples stored under an argon or a gaseous
O or CO atmosphere, while the samples exposed to water purged with nitrogen
2
2
and oxygen showed a very slow increase. This was especially visible during the first
thirty hours, and continued very slowly for the following 300 hours. A larger impact
was observed for the samples that were stored in water without purging, therefore
naturally containing some atmospheric gases. This sample showed a twofold increase
over 210 hours of exposure time. The HO/air showed the largest increase, which
2
-3
resulted in a sheet resistance of over 80 Ω/☐ or 4x10 Ωcm after 310 hours.
The main reason for the increase in resistivity could be found in the electron mobility
H 2 O/air
3 H 2 O
H 2 O/O 2
-3 Ω cm) 2 H 2 O/N 2
CO 2
Glovebox
Resistivity (10 1
0
0 50 100 150 200 250 300 350
Figure 6.14 Exposure time (hours)
Development of the resistivity of ZnO:Al as a function of exposure time to the various species.
Figure 6.14: Development of the resistivity of ZnO:Al as a
function of exposure time to the various conditions
195