Page 198 - Mirjam-Theelen-Degradation-of-CIGS-solar-cells
P. 198
Chapter 6
(a) 30 (b) 7
Mobility (cm 2 /Vs) 20 H 2 O/air Carrier concentration (10 20 cm -3 ) 6 5 H 2 O/air
H 2 O
H 2 O
10
H 2 O/O 2
H 2 O/N 2
H 2 O/N 2 H 2 O/O 2
CO 2 4 CO 2
Glovebox Glovebox
0
0 100 200 300 0 100 200 300
Figure 6.15 Exposure time (hours) Exposure time (hours)
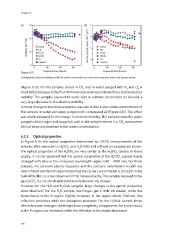
Development of (a) the mobility and (b) the carrier concentration as a function of exposure time to the various species.
(Figure 6.15). For the samples stored in CO and in water purged with N and O, a
2
2
2
small initial decrease in the first 100 hours was observed, followed by a stable electron
mobility. The samples exposed to water with or without compressed air showed a
very large decrease in this electron mobility.
A minor change in electrical properties was also visible in the carrier concentration of
the samples in water and water purged with compressed air (Figure 6.15). This effect
was small compared to the change in electron mobility. The samples stored in water
purged with nitrogen and oxygen as well as the samples stored in a CO atmosphere
2
did not show any decrease in the carrier concentration.
6.3.3 Optical properties
In Figure 6.16, the optical properties determined by UV-VIS measurements of the
samples after exposure to HO/O and H O with and without air purging are shown.
2
2
2
The optical properties of the HO/N are very similar to the HO/O sample. In these
2
2
2
2
graphs, it can be observed that the optical parameters of the HO/O sample barely
2
2
changed with time in the measured wavelength region (240 – 2400 nm). For these
samples, the constant plasma frequency and the constant transmission in both the
near infrared and the UV region imply that the carrier concentration is constant in the
bulk of the film, as is also observed in Hall measurements. The samples exposed to the
gases (CO , O ) are not depicted but barely showed any change.
2
2
However, for the HO and HO/air samples, large changes in the optical properties
2
2
were observed. For the HO sample, the fringes get a little bit weaker, while the
2
transmission in the IR region slightly increases. In the region above 1500 nm, the
reflection decreases while the absorption increases. For the HO/air sample, these
2
effects became stronger: the fringes have completely disappeared, the transmission
in the IR region has increased, while the reflection in this region decreased.
196
(a) 30 (b) 7
Mobility (cm 2 /Vs) 20 H 2 O/air Carrier concentration (10 20 cm -3 ) 6 5 H 2 O/air
H 2 O
H 2 O
10
H 2 O/O 2
H 2 O/N 2
H 2 O/N 2 H 2 O/O 2
CO 2 4 CO 2
Glovebox Glovebox
0
0 100 200 300 0 100 200 300
Figure 6.15 Exposure time (hours) Exposure time (hours)
Development of (a) the mobility and (b) the carrier concentration as a function of exposure time to the various species.
(Figure 6.15). For the samples stored in CO and in water purged with N and O, a
2
2
2
small initial decrease in the first 100 hours was observed, followed by a stable electron
mobility. The samples exposed to water with or without compressed air showed a
very large decrease in this electron mobility.
A minor change in electrical properties was also visible in the carrier concentration of
the samples in water and water purged with compressed air (Figure 6.15). This effect
was small compared to the change in electron mobility. The samples stored in water
purged with nitrogen and oxygen as well as the samples stored in a CO atmosphere
2
did not show any decrease in the carrier concentration.
6.3.3 Optical properties
In Figure 6.16, the optical properties determined by UV-VIS measurements of the
samples after exposure to HO/O and H O with and without air purging are shown.
2
2
2
The optical properties of the HO/N are very similar to the HO/O sample. In these
2
2
2
2
graphs, it can be observed that the optical parameters of the HO/O sample barely
2
2
changed with time in the measured wavelength region (240 – 2400 nm). For these
samples, the constant plasma frequency and the constant transmission in both the
near infrared and the UV region imply that the carrier concentration is constant in the
bulk of the film, as is also observed in Hall measurements. The samples exposed to the
gases (CO , O ) are not depicted but barely showed any change.
2
2
However, for the HO and HO/air samples, large changes in the optical properties
2
2
were observed. For the HO sample, the fringes get a little bit weaker, while the
2
transmission in the IR region slightly increases. In the region above 1500 nm, the
reflection decreases while the absorption increases. For the HO/air sample, these
2
effects became stronger: the fringes have completely disappeared, the transmission
in the IR region has increased, while the reflection in this region decreased.
196