Page 139 - Mirjam-Theelen-Degradation-of-CIGS-solar-cells
P. 139
Degradation mechanisms of the molybdenum back contact
holder. On Mo15, the material in the upper right corner of the sample had even
delaminated. The selenised samples had changed severely in the last degradation
steps. The coloured spots on the edge of the selenised samples changed into dark
grey patches after 105 hours of degradation. The small spots in the middle area of
Mo10Se and Mo15Se had grown larger and formed a mosaic-like layer. The spots on
Mo10Se were mostly blue, while the spots on Mo15Se were mostly brown. Mo2Se
seemed to have retained its reflective surface, though if this sample was studied
under reflective lighting, the surface is also covered with spots.
The samples were further studied by optical microscopy in which the above
observations were confirmed.
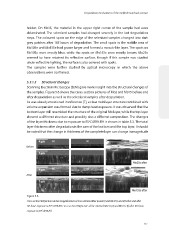
5.3.1.3 Structural changes
Scanning Electron Microscopy (SEM) gave more insight into the structural changes of
the samples. Figure 5.6 shows the cross-section pictures of Mo2 and Mo15 before and
after degradation as well as the selenised samples after degradation.
As was already mentioned in reference [7], a clear multilayer structure combined with
volume expansion was formed due to damp heat exposure. It was observed that the
bottom layer still resembled the structure of the original Mo layer, while the top layer
showed a different structure and possibly also a different composition. The changes
of the layer thickness due to exposure to 85 C/85% RH is shown in table 5.3. The total
o
layer thickness after degradation is the sum of the bottom and the top layer. It should
be noted that the change in thickness of the complete layer can change in magnitude
4 μm (a) (c) (e)
Before
1 μm
4 μm (b) (d) (f)
After
1 μm
Figure 5.6
Cross-section SEM pictures at two magnifications of non-selenised Mo2 (a and b) and Mo15 (c and d) before and after
o
105 hours exposure to 85 C/85% RH. Cross-section SEM pictures of the selenised Mo2Se (e) and Mo15Se (f) after 105 hours
exposure to 85 C/85% RH.
o
137
holder. On Mo15, the material in the upper right corner of the sample had even
delaminated. The selenised samples had changed severely in the last degradation
steps. The coloured spots on the edge of the selenised samples changed into dark
grey patches after 105 hours of degradation. The small spots in the middle area of
Mo10Se and Mo15Se had grown larger and formed a mosaic-like layer. The spots on
Mo10Se were mostly blue, while the spots on Mo15Se were mostly brown. Mo2Se
seemed to have retained its reflective surface, though if this sample was studied
under reflective lighting, the surface is also covered with spots.
The samples were further studied by optical microscopy in which the above
observations were confirmed.
5.3.1.3 Structural changes
Scanning Electron Microscopy (SEM) gave more insight into the structural changes of
the samples. Figure 5.6 shows the cross-section pictures of Mo2 and Mo15 before and
after degradation as well as the selenised samples after degradation.
As was already mentioned in reference [7], a clear multilayer structure combined with
volume expansion was formed due to damp heat exposure. It was observed that the
bottom layer still resembled the structure of the original Mo layer, while the top layer
showed a different structure and possibly also a different composition. The changes
of the layer thickness due to exposure to 85 C/85% RH is shown in table 5.3. The total
o
layer thickness after degradation is the sum of the bottom and the top layer. It should
be noted that the change in thickness of the complete layer can change in magnitude
4 μm (a) (c) (e)
Before
1 μm
4 μm (b) (d) (f)
After
1 μm
Figure 5.6
Cross-section SEM pictures at two magnifications of non-selenised Mo2 (a and b) and Mo15 (c and d) before and after
o
105 hours exposure to 85 C/85% RH. Cross-section SEM pictures of the selenised Mo2Se (e) and Mo15Se (f) after 105 hours
exposure to 85 C/85% RH.
o
137