Page 142 - Mirjam-Theelen-Degradation-of-CIGS-solar-cells
P. 142
Chapter 5
15000
12500
10000
Intensity (counts) 7500
5000
2500
0
250 500 750 1000 1250 1500 1750 2000
-1
Figure 5.10 Raman shift [cm ]
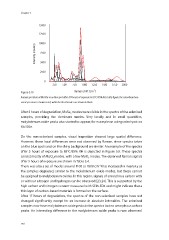
Raman spectrum of Mo10Se on a blue spot after 105 hours of exposure to 85 C/85% RH. In this figure, the smoothed mea-
o
sured spectrum is shown in red, while the fitted modes are shown in black.
After 5 hours of degradation, MoSe modes were visible in the spectra of the selenised
2
samples, providing the dominant modes. Very locally and in small quantities,
molybdenum oxide peaks also started to appear, for example on a degraded spot on
Mo10Se.
On the non-selenised samples, visual inspection showed large spatial difference.
However, these local differences were not observed by Raman, since spectra taken
on the blue spots and on the shiny background are similar. An example of the spectra
o
after 5 hours of exposure to 85C/85% RH is depicted in Figure 5.9. These spectra
consist mostly of MoO modes, with a few MoO modes. The observed Raman signals
3
2
after 5 hours of exposure are shown in Table 5.4 .
There was also a set of modes around 1100 to 1800 cm that increased in intensity as
-1
the samples degraded, similar to the molybdenum oxide modes, but these cannot
be assigned to molybdenum oxides. In this region, signals of amorphous carbon with
or without nitrogen and hydrogen can be observed [23,24]. This is supported by the
high carbon and nitrogen content measured with SEM-EDX and might indicate that a
thin layer of carbon-based materials is formed on the surface.
After 17 hours of degradation, the spectra of the non-selenised samples have not
changed significantly except for an increase in absolute intensities. The selenised
samples now have molybdenum oxide peaks in the spectra but no amorphous carbon
peaks. An interesting difference in the molybdenum oxide peaks is now observed.
140
15000
12500
10000
Intensity (counts) 7500
5000
2500
0
250 500 750 1000 1250 1500 1750 2000
-1
Figure 5.10 Raman shift [cm ]
Raman spectrum of Mo10Se on a blue spot after 105 hours of exposure to 85 C/85% RH. In this figure, the smoothed mea-
o
sured spectrum is shown in red, while the fitted modes are shown in black.
After 5 hours of degradation, MoSe modes were visible in the spectra of the selenised
2
samples, providing the dominant modes. Very locally and in small quantities,
molybdenum oxide peaks also started to appear, for example on a degraded spot on
Mo10Se.
On the non-selenised samples, visual inspection showed large spatial difference.
However, these local differences were not observed by Raman, since spectra taken
on the blue spots and on the shiny background are similar. An example of the spectra
o
after 5 hours of exposure to 85C/85% RH is depicted in Figure 5.9. These spectra
consist mostly of MoO modes, with a few MoO modes. The observed Raman signals
3
2
after 5 hours of exposure are shown in Table 5.4 .
There was also a set of modes around 1100 to 1800 cm that increased in intensity as
-1
the samples degraded, similar to the molybdenum oxide modes, but these cannot
be assigned to molybdenum oxides. In this region, signals of amorphous carbon with
or without nitrogen and hydrogen can be observed [23,24]. This is supported by the
high carbon and nitrogen content measured with SEM-EDX and might indicate that a
thin layer of carbon-based materials is formed on the surface.
After 17 hours of degradation, the spectra of the non-selenised samples have not
changed significantly except for an increase in absolute intensities. The selenised
samples now have molybdenum oxide peaks in the spectra but no amorphous carbon
peaks. An interesting difference in the molybdenum oxide peaks is now observed.
140