Page 141 - Mirjam-Theelen-Degradation-of-CIGS-solar-cells
P. 141
Degradation mechanisms of the molybdenum back contact
20 μm
Figure 5.8
SEM pictures of the non-selenised Mo2 (left) and selenised Mo15Se (right) after 105 hours exposure to 85 C/85% RH.
o
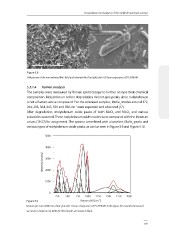
5.3.1.4 Raman analysis
The samples were measured by Raman spectroscopy to further analyse their chemical
composition. Molybdenum before degradation did not give peaks, since molybdenum
is not a Raman-active compound. For the selenised samples, MoSe modes around 172,
2
-1
244, 293, 364, 443, 520 and 590 cm were expected and observed [17].
After degradation, molybdenum oxide peaks of both MoO and MoO and various
2
3
suboxides occurred. These molybdenum oxide modes were compared with the literature
values [18-22] for assignment. The spectra were fitted with a baseline, MoSe 2 peaks and
various types of molybdenum oxide peaks, as can be seen in Figure 5.9 and Figure 5.10 .
5000
4000
Intensity (counts) 3000
2000
1000
0
250 500 750 1000 1250 1500 1750 2000
-1
Figure 5.9 Raman shift [cm ]
Raman spectrum of Mo2 on a blue spot after 5 hours of exposure to 85 C/85% RH. In this figure, the smoothed measured
o
spectrum is shown in red, while the fitted modes are shown in black.
139
20 μm
Figure 5.8
SEM pictures of the non-selenised Mo2 (left) and selenised Mo15Se (right) after 105 hours exposure to 85 C/85% RH.
o
5.3.1.4 Raman analysis
The samples were measured by Raman spectroscopy to further analyse their chemical
composition. Molybdenum before degradation did not give peaks, since molybdenum
is not a Raman-active compound. For the selenised samples, MoSe modes around 172,
2
-1
244, 293, 364, 443, 520 and 590 cm were expected and observed [17].
After degradation, molybdenum oxide peaks of both MoO and MoO and various
2
3
suboxides occurred. These molybdenum oxide modes were compared with the literature
values [18-22] for assignment. The spectra were fitted with a baseline, MoSe 2 peaks and
various types of molybdenum oxide peaks, as can be seen in Figure 5.9 and Figure 5.10 .
5000
4000
Intensity (counts) 3000
2000
1000
0
250 500 750 1000 1250 1500 1750 2000
-1
Figure 5.9 Raman shift [cm ]
Raman spectrum of Mo2 on a blue spot after 5 hours of exposure to 85 C/85% RH. In this figure, the smoothed measured
o
spectrum is shown in red, while the fitted modes are shown in black.
139