Page 144 - Mirjam-Theelen-Degradation-of-CIGS-solar-cells
P. 144
Chapter 5
-1
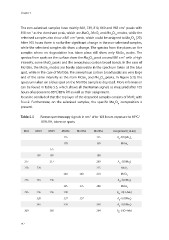
The non-selenised samples have mainly 660, 739, 810, 860 and 958 cm peaks with
-1
810 cm as the dominant peak, which are MoO, MoO and Mo O modes, while the
2
3
23
8
selenised samples also show a 881 cm peak, which could be assigned to Mo O [20].
-1
11
4
After 105 hours there is no further significant change in the non-selenised samples,
while the selenised samples do show a change. The spectra from the places on the
samples where no degradation has taken place still show only MoSe peaks. The
2
spectra from spots on the surface show the Mo O peak around 881 cm with a high
-1
4
11
intensity, some MoO peaks and the amorphous carbon broad bands. In the case of
3
Mo10Se, the MoSe modes are barely observable in the spectrum taken at the blue
2
spot, while in the case of Mo15Se, the amorphous carbon broad peaks are very large
and of the same intensity as the main MoSe and MoO peaks. In Figure 5.10, the
11
2
4
spectrum taken on a blue spot on the Mo10Se sample is depicted. More information
can be found in Table 5.5 , which shows all the Raman signals as measured after 105
o
hours of exposure to 85 C/85% RH as well as their assignment.
It can be concluded that the top layer of the degraded samples consists of MoO with
x
3>x>2. Furthermore, on the selenised samples, the specific MoO composition is
11
4
present.
o
-1
Table 5.5 Raman spectroscopy signals in cm after 105 hours exposure to 85 C/
85% RH, taken on spots
Mo2 Mo10 Mo15 Mo2Se Mo10Se Mo15Se Assignment [14-24]
155 155 A g -δ(O 2 Mo 2 ) n
170 169 MoSe 2
175
192 192 189
217 217 209 A g - δ(OMo 2 )
228 228 225 MoO 2
240 240 238 MoSe 2
246 246 246 A g - δ(OMo 2 )
285 275 288 MoSe 2
296 296 296 290 B 2g - δ(O=Mo)
328 337 337 A g - δ (OMo 3 )
346 350 348 A g - δ (OMo 2 )
369 365 364 A g - δ (O=Mo)
142
-1
The non-selenised samples have mainly 660, 739, 810, 860 and 958 cm peaks with
-1
810 cm as the dominant peak, which are MoO, MoO and Mo O modes, while the
2
3
23
8
selenised samples also show a 881 cm peak, which could be assigned to Mo O [20].
-1
11
4
After 105 hours there is no further significant change in the non-selenised samples,
while the selenised samples do show a change. The spectra from the places on the
samples where no degradation has taken place still show only MoSe peaks. The
2
spectra from spots on the surface show the Mo O peak around 881 cm with a high
-1
4
11
intensity, some MoO peaks and the amorphous carbon broad bands. In the case of
3
Mo10Se, the MoSe modes are barely observable in the spectrum taken at the blue
2
spot, while in the case of Mo15Se, the amorphous carbon broad peaks are very large
and of the same intensity as the main MoSe and MoO peaks. In Figure 5.10, the
11
2
4
spectrum taken on a blue spot on the Mo10Se sample is depicted. More information
can be found in Table 5.5 , which shows all the Raman signals as measured after 105
o
hours of exposure to 85 C/85% RH as well as their assignment.
It can be concluded that the top layer of the degraded samples consists of MoO with
x
3>x>2. Furthermore, on the selenised samples, the specific MoO composition is
11
4
present.
o
-1
Table 5.5 Raman spectroscopy signals in cm after 105 hours exposure to 85 C/
85% RH, taken on spots
Mo2 Mo10 Mo15 Mo2Se Mo10Se Mo15Se Assignment [14-24]
155 155 A g -δ(O 2 Mo 2 ) n
170 169 MoSe 2
175
192 192 189
217 217 209 A g - δ(OMo 2 )
228 228 225 MoO 2
240 240 238 MoSe 2
246 246 246 A g - δ(OMo 2 )
285 275 288 MoSe 2
296 296 296 290 B 2g - δ(O=Mo)
328 337 337 A g - δ (OMo 3 )
346 350 348 A g - δ (OMo 2 )
369 365 364 A g - δ (O=Mo)
142