Page 189 - Mirjam-Theelen-Degradation-of-CIGS-solar-cells
P. 189
Degradation mechanisms of the aluminium doped zinc oxide front contact
with the glass, allowing direct migration of the cations. However, in CIGS cells, the
glass cations have to travel through multiple layers to reach the zinc oxide, which
will slow down this process. Furthermore, stain formation on top of the zinc oxide is
probably hindered by the encapsulation materials, like Ethylene-Vinyl Acetate (EVA).
Another difference with CIGS solar cells is the presence of sodium, which was not
present in the Corning XG type glass. However, during the deposition of the CIGS layer,
sodium is present. In some cases, this element is obtained from the substrate soda lime
glass, which contains a high concentration of sodium, while other producers choose
to add the sodium in a controlled way, for example by NaF deposition. In either cases,
sodium is present in the CIGS layer, which is located close to the zinc oxide layer and
can play a role in the degradation process. More information about this topic can also
be found in the chapter 7.
6.3.1.3 Optical properties
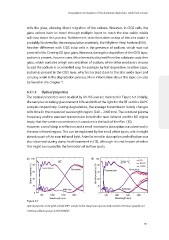
The optical properties were studied by UV-VIS and are depicted in Figure 6.7. Initially,
the samples including glass transmit 81% and 84% of the light for the RT and the 200 o C
samples respectively. During degradation, the average transmission barely changes
with time in the measured wavelength region (240 – 2400 nm). The constant plasma
frequency and the constant transmission in both the near infrared and the UV region
imply that the carrier concentration is constant in the bulk of the film [12].
However, a small drop in reflection and a small increase in absorption was observed in
the near infrared region. This can be explained by the small white spots, which might
absorb a part of the near infrared light. A similar trend in absorption and reflection was
also observed during damp heat treatment in [13], although it is not known whether
this might be caused by the formation of surface spots.
(a) 100 (b) 100 0 h
o
RT 80 200 C 1035 h
80
Optical properties (%) 60 Transmission Absorption Optical properties (%) 60 Transmission Absorption
2344 h
40
40
20 20
Reflection Reflection
0 0
500 1000 1500 2000 500 1000 1500 2000
Wavelength (nm) Wavelength (nm)
Figure 6.7
Optical properties of the (a) RT and (b) 200 C samples before damp heat exposure (red) and after 1035 hours (purple) and
o
o
2344 hours (blue) exposure to 85 C/85% RH.
187
with the glass, allowing direct migration of the cations. However, in CIGS cells, the
glass cations have to travel through multiple layers to reach the zinc oxide, which
will slow down this process. Furthermore, stain formation on top of the zinc oxide is
probably hindered by the encapsulation materials, like Ethylene-Vinyl Acetate (EVA).
Another difference with CIGS solar cells is the presence of sodium, which was not
present in the Corning XG type glass. However, during the deposition of the CIGS layer,
sodium is present. In some cases, this element is obtained from the substrate soda lime
glass, which contains a high concentration of sodium, while other producers choose
to add the sodium in a controlled way, for example by NaF deposition. In either cases,
sodium is present in the CIGS layer, which is located close to the zinc oxide layer and
can play a role in the degradation process. More information about this topic can also
be found in the chapter 7.
6.3.1.3 Optical properties
The optical properties were studied by UV-VIS and are depicted in Figure 6.7. Initially,
the samples including glass transmit 81% and 84% of the light for the RT and the 200 o C
samples respectively. During degradation, the average transmission barely changes
with time in the measured wavelength region (240 – 2400 nm). The constant plasma
frequency and the constant transmission in both the near infrared and the UV region
imply that the carrier concentration is constant in the bulk of the film [12].
However, a small drop in reflection and a small increase in absorption was observed in
the near infrared region. This can be explained by the small white spots, which might
absorb a part of the near infrared light. A similar trend in absorption and reflection was
also observed during damp heat treatment in [13], although it is not known whether
this might be caused by the formation of surface spots.
(a) 100 (b) 100 0 h
o
RT 80 200 C 1035 h
80
Optical properties (%) 60 Transmission Absorption Optical properties (%) 60 Transmission Absorption
2344 h
40
40
20 20
Reflection Reflection
0 0
500 1000 1500 2000 500 1000 1500 2000
Wavelength (nm) Wavelength (nm)
Figure 6.7
Optical properties of the (a) RT and (b) 200 C samples before damp heat exposure (red) and after 1035 hours (purple) and
o
o
2344 hours (blue) exposure to 85 C/85% RH.
187