Page 191 - Mirjam-Theelen-Degradation-of-CIGS-solar-cells
P. 191
Degradation mechanisms of the aluminium doped zinc oxide front contact
As can be seen in Figure 6.8, the resistivity is higher for the RT sample, indicating a
higher initial resistivity as well as a faster degradation. Since the resistivity increase can
be fitted with a square root function, the conductivity automatically follows a 1/√(t)
trend. Therefore, the resistivity change can be linked with a diffusion-like process, in
which a species from an infinite reservoir diffuses into a semi-porous material. The
diffusion of the species in the sample will thus be the rate-determining step, while
the reaction between the diffusion species and the grain boundary atoms inside the
sample is a quicker process.
In literature, it has been observed that thick samples have a lower degradation rate
than thin samples [4,7,9]. This is explained by either a diffusion based degradation
process that starts from the surface and gradually deepened into the layer [9] or by
a difference in grain sizes or structures for different thicknesses [7]. In this case, we
confirm that diffusion controls the resistivity increase.
o
The difference in resistivity increase between the 200C and RT samples cannot be
explained purely by the difference in thickness, since the samples were respectively
490 and 620 nm thick, which cannot account for the large difference in the rate of
resistivity increase. We therefore propose that the diffusion rate is explained by the
number of diffusion channels present, for example grain boundaries.
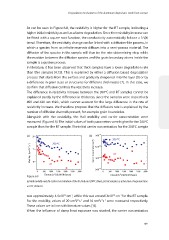
Alongside with the resistivity, the Hall mobility and carrier concentration were
o
measured (Figure 6.9). The initial values of both parameters were higher for the 200 C
sample than for the RT sample. The initial carrier concentration for the 200C sample
o
(a) 20 (b) 5x10 20
o
200 C
o
200 C
(cm 2 V -1 s -1 ) 15 Carrier concentration (cm -3 ) 4x10 20
Mobility 3x10 20 RT
10
RT
2x10 20
0 500 1000 1500 2000 2500 3000 0 500 1000 1500 2000 2500 3000
o
o
Figure 6.9 Time at 85 C/85% RH (hours) Time at 85 C/85% RH (hours)
o
(a) Hall mobility and (b) carrier concentration of the RT (red) and 200 C (blue) ZnO:Al samples as a function of exposure time
to 85 C/85% RH.
o
20
was approximately 4.5x10 cm , while this was around 3x10 cm for the RT sample.
-1
20
-1
For the mobility, values of 20 cmV s and 16 cmV s were measured respectively.
2 -1 -1
2 -1 -1
These values are in line with literature values [14].
When the influence of damp heat exposure was studied, the carrier concentration
189
As can be seen in Figure 6.8, the resistivity is higher for the RT sample, indicating a
higher initial resistivity as well as a faster degradation. Since the resistivity increase can
be fitted with a square root function, the conductivity automatically follows a 1/√(t)
trend. Therefore, the resistivity change can be linked with a diffusion-like process, in
which a species from an infinite reservoir diffuses into a semi-porous material. The
diffusion of the species in the sample will thus be the rate-determining step, while
the reaction between the diffusion species and the grain boundary atoms inside the
sample is a quicker process.
In literature, it has been observed that thick samples have a lower degradation rate
than thin samples [4,7,9]. This is explained by either a diffusion based degradation
process that starts from the surface and gradually deepened into the layer [9] or by
a difference in grain sizes or structures for different thicknesses [7]. In this case, we
confirm that diffusion controls the resistivity increase.
o
The difference in resistivity increase between the 200C and RT samples cannot be
explained purely by the difference in thickness, since the samples were respectively
490 and 620 nm thick, which cannot account for the large difference in the rate of
resistivity increase. We therefore propose that the diffusion rate is explained by the
number of diffusion channels present, for example grain boundaries.
Alongside with the resistivity, the Hall mobility and carrier concentration were
o
measured (Figure 6.9). The initial values of both parameters were higher for the 200 C
sample than for the RT sample. The initial carrier concentration for the 200C sample
o
(a) 20 (b) 5x10 20
o
200 C
o
200 C
(cm 2 V -1 s -1 ) 15 Carrier concentration (cm -3 ) 4x10 20
Mobility 3x10 20 RT
10
RT
2x10 20
0 500 1000 1500 2000 2500 3000 0 500 1000 1500 2000 2500 3000
o
o
Figure 6.9 Time at 85 C/85% RH (hours) Time at 85 C/85% RH (hours)
o
(a) Hall mobility and (b) carrier concentration of the RT (red) and 200 C (blue) ZnO:Al samples as a function of exposure time
to 85 C/85% RH.
o
20
was approximately 4.5x10 cm , while this was around 3x10 cm for the RT sample.
-1
20
-1
For the mobility, values of 20 cmV s and 16 cmV s were measured respectively.
2 -1 -1
2 -1 -1
These values are in line with literature values [14].
When the influence of damp heat exposure was studied, the carrier concentration
189