Page 194 - Mirjam-Theelen-Degradation-of-CIGS-solar-cells
P. 194
Chapter 6
of magnitude in 300-500 nm and is everywhere higher than before degradation.
o
When comparing the RT sample with the 200C sample, it was observed that the
hydroxyl profile has a slightly higher maximum value for the RT film, which indicates
more water has been taken up by this sample. This can be explained by the higher
number of grain boundaries.
(a) (b)
10 5 10 5
Before degradation After degradation
-
10 4 - O - OH - 10 4 O - OH
Intensity (counts) 10 3 2 ZnO - - Intensity (counts) 10 3 2 H - ZnO - -
H
Cl
10
10
-
C
10 1 Cl C - 10 1 -
S
10 0 S - 10 0
0 100 200 300 400 500 600 700 0 100 200 300 400 500 600 700
Depth (nm) Depth (nm)
Figure 6.11
o
SIMS depth profiles taken in the negative mode of a (a) RT sample before and (b) after exposure to 85 C/85% RH.
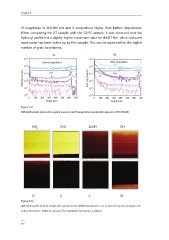
AlO 2 - ZnO - ZnOH - OH -
Cl - S - C - Si -
Figure 6.12
o
SIMS depth profiles of the RT sample after exposure to 85 C/85% RH visualised as cross sections: the top of each image is the
surface, the bottom ~20% is the substrate. The total width of the pictures is 300 μm.
192
of magnitude in 300-500 nm and is everywhere higher than before degradation.
o
When comparing the RT sample with the 200C sample, it was observed that the
hydroxyl profile has a slightly higher maximum value for the RT film, which indicates
more water has been taken up by this sample. This can be explained by the higher
number of grain boundaries.
(a) (b)
10 5 10 5
Before degradation After degradation
-
10 4 - O - OH - 10 4 O - OH
Intensity (counts) 10 3 2 ZnO - - Intensity (counts) 10 3 2 H - ZnO - -
H
Cl
10
10
-
C
10 1 Cl C - 10 1 -
S
10 0 S - 10 0
0 100 200 300 400 500 600 700 0 100 200 300 400 500 600 700
Depth (nm) Depth (nm)
Figure 6.11
o
SIMS depth profiles taken in the negative mode of a (a) RT sample before and (b) after exposure to 85 C/85% RH.
AlO 2 - ZnO - ZnOH - OH -
Cl - S - C - Si -
Figure 6.12
o
SIMS depth profiles of the RT sample after exposure to 85 C/85% RH visualised as cross sections: the top of each image is the
surface, the bottom ~20% is the substrate. The total width of the pictures is 300 μm.
192