Page 145 - Mirjam-Theelen-Degradation-of-CIGS-solar-cells
P. 145
Degradation mechanisms of the molybdenum back contact
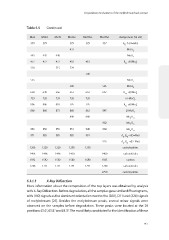
Table 5.5 Continued
Mo2 Mo10 Mo15 Mo2Se Mo10Se Mo15Se Assignment [14-24]
379 379 379 379 437 A g - δ (O=Mo)
437 MoSe 2
445 445 440 MoO 2
477 477 477 483 483 B 1g - ν(OMo 3 )
520 515 529
540
565 MoO 2
588 585 MoSe 2
660 648 666 661 663 687 B 3g - ν(OMo 3 )
739 728 739 720 720 m-MoO 2
806 806 810 795 795 B 1g - ν(OMo 2 )
860 860 873 860 862 845 β-MoO 3
890 888 Mo 4 O 11
902 Mo 4 O 11
956 950 955 951 948 968 Mo 8 O 23
971 985 985 985 981 A g , B 1g - ν(O=Mo)
995 A g , B 1g - ν(O=Mo)
1206 1220 1220 1250 1250 carbohydrites
1496 1496 1496 1430 1400 carbonitrides
1592 1592 1592 1580 1580 1585 carbon
1748 1721 1721 1791 1791 1740 carbonitrides
2750 carbohydrites
5.3.1.5 X-Ray Diffraction
More information about the composition of the top layers was obtained by analysis
with X-Ray Diffraction. Before degradation, all the samples gave similar diffractograms,
with (110) signals as the dominant orientation next to the (200), (211) and (220) signals
of molybdenum [25]. Besides the molybdenum peaks, several minor signals were
observed on the samples before degradation. These peaks were located at the 2θ
positions 43.6°, 63.8° and 81.3°. The most likely candidates for the identification of these
143