Page 146 - Mirjam-Theelen-Degradation-of-CIGS-solar-cells
P. 146
Chapter 5
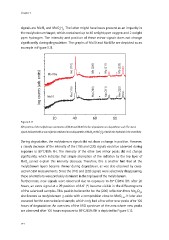
signals are MoN and MoO H . The latter might have been present as an impurity in
y
2
x
the molybdenum target, which contained up to 40 weight ppm oxygen and 2 weight
ppm hydrogen. The intensity and position of these minor signals does not change
significantly during degradation. The graphs of Mo10 and Mo10Se are depicted as an
example in Figure 5.11.
Mo (110) * Mo (200) * Mo (211) * Mo (220)
log counts (arb. units) Mo10 Mo (110) * Mo (200) * Mo (211) * Mo (220)
Mo10Se
20 40 60 80
Figure 5.11 o
2 ( )
XRD patterns of the molybdenum orientations of Mo10 and Mo10Se before degradation on a logarithmic scale. The minor
signals indicated with a star might be attributed to small quantities of MoN or MoO x H y of which the hydroxide is the most likely.
2
During degradation, the molybdenum signals did not show a change in position. However,
a steady decrease of the intensity of the (110) and (220) signals could be observed during
exposure to 85C/85% RH. The intensity of the other two minor peaks did not change
o
significantly, which indicates that simple absorption of the radiation by the top layer of
MoO cannot explain this intensity decrease. Therefore, this is another hint that all the
x
molybdenum layers became thinner during degradation, as was also observed by cross-
section SEM measurements. Since the (110) and (220) signals were selectively disappearing,
these orientations were probably dominant in the top layer of the molybdenum.
Furthermore, new signals were observed due to exposure to 85C/85% RH: after 20
o
hours, an extra signal at a 2θ position of 8.6° (*) became visible in the diffractograms
of the selenised samples. This peak is believed to be the (200) reflection from Mo O ,
17
47
also known as molybdenum χ-oxide with a composition close to MoO . It later also
2.78
occurred for the non-selenised sample, which only had a few other new peaks after 105
hours of degradation. An overview of the XRD spectrum of the area where new peaks
o
are observed after 105 hours exposure to 85 C/85% RH is depicted in Figure 5.12.
144