Page 147 - Mirjam-Theelen-Degradation-of-CIGS-solar-cells
P. 147
Degradation mechanisms of the molybdenum back contact
*
Mo15Se
*
Mo10Se
*
Intensity (a.u.) Mo2Se
Mo15 *
Mo10 *
Mo2 *
5 10 15 20 25 30
Figure 5.12 2 ( )
o
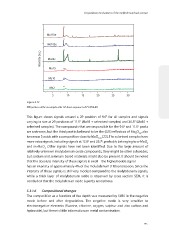
XRD patterns of the six samples after 105 hours exposure to 85 C/85% RH.
This figure shows signals around a 2θ position of 9.6° for all samples and signals
varying in size at 2θ positions of 11.5° (Mo15 + selenised samples) and 26.8° (Mo10 +
o
o
selenised samples). The compounds that are responsible for the 9.6 and 11.5 peaks
-
are unknown, but the third peak is believed to be the (025) reflection of Mo O , also
26
9
known as ζ-oxide with a composition close to MoO 2.89 [22]. The selenised samples have
more extra signals, including signals at 12.8 and 25.7 , probably belonging to o-MoO
o
o
3
and m-MoO Other signals have not been identified. Due to the large amount of
3.
relatively unknown molybdenum oxide compounds, they might be other suboxides,
but sodium and selenium based materials might also be present. It should be noted
that the absolute intensity of these signals is small – the highest oxide signal
has an intensity of approximately 4% of the molybdenum (110) orientation. Since the
intensity of these signals is still very modest compared to the molybdenum signals,
while a thick layer of molybdenum oxide is observed by cross-section SEM, it is
concluded that the molybdenum oxide is partly amorphous.
5.3.1.6 Compositional changes
The composition as a function of the depth was measured by SIMS in the negative
mode before and after degradation. The negative mode is very sensitive to
electronegative elements (fluorine, chlorine, oxygen, sulphur and also carbon and
hydroxide), but there is little information on metal contamination.
145
*
Mo15Se
*
Mo10Se
*
Intensity (a.u.) Mo2Se
Mo15 *
Mo10 *
Mo2 *
5 10 15 20 25 30
Figure 5.12 2 ( )
o
XRD patterns of the six samples after 105 hours exposure to 85 C/85% RH.
This figure shows signals around a 2θ position of 9.6° for all samples and signals
varying in size at 2θ positions of 11.5° (Mo15 + selenised samples) and 26.8° (Mo10 +
o
o
selenised samples). The compounds that are responsible for the 9.6 and 11.5 peaks
-
are unknown, but the third peak is believed to be the (025) reflection of Mo O , also
26
9
known as ζ-oxide with a composition close to MoO 2.89 [22]. The selenised samples have
more extra signals, including signals at 12.8 and 25.7 , probably belonging to o-MoO
o
o
3
and m-MoO Other signals have not been identified. Due to the large amount of
3.
relatively unknown molybdenum oxide compounds, they might be other suboxides,
but sodium and selenium based materials might also be present. It should be noted
that the absolute intensity of these signals is small – the highest oxide signal
has an intensity of approximately 4% of the molybdenum (110) orientation. Since the
intensity of these signals is still very modest compared to the molybdenum signals,
while a thick layer of molybdenum oxide is observed by cross-section SEM, it is
concluded that the molybdenum oxide is partly amorphous.
5.3.1.6 Compositional changes
The composition as a function of the depth was measured by SIMS in the negative
mode before and after degradation. The negative mode is very sensitive to
electronegative elements (fluorine, chlorine, oxygen, sulphur and also carbon and
hydroxide), but there is little information on metal contamination.
145