Page 151 - Mirjam-Theelen-Degradation-of-CIGS-solar-cells
P. 151
Degradation mechanisms of the molybdenum back contact
reflectance, while the Mo2Se sample has a slightly decreased reflectance. The Mo2Se
sample also showed less severe degradation on the photographs. After 105 hours of
degradation, the reflectance of all samples except Mo2Se has decreased to around
10%, as seen in Figure 5.15. The low pressure sample with selenide is thus the only
sample which largely retains its reflective properties.
5.3.2 Lift-off experiment
5.3.2.1 Visual changes
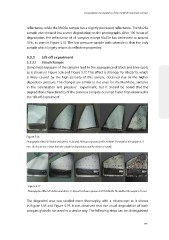
Damp heat exposure of the samples lead to the appearance of black and blue spots
as is shown in Figure 5.16 and Figure 5.17. This effect is stronger for Mo25/15, which
is likely caused by the high porosity of this sample, obtained due to the higher
deposition pressure. The changes are similar to the ones for the Mo/MoSe samples
2
in the ‘selenisation and pressure’ experiment, but it should be noted that the
degradation characteristics of the previous samples occurred faster than observed in
the ‘lift-off experiment’.
Figure 5.16
o
Photographs of Mo25/2 before and after 8, 32, 88 and 150 hours exposure to 85 C/85% RH. The width of the samples is 21
mm. The first pictures shows both the sample for degradation and the reference sample.
Figure 5.17
Photographs of Mo25/15 before and after 8, 32, 88 and 150 hours exposure to 85 o C/85% RH. The width of the sample is 25 mm.
The degraded area was studied more thoroughly with a microscope as is shown
in Figure 5.18 and Figure 5.19. It was observed that the visual degradation of both
samples globally occurred in a similar way. The following steps can be distinguished
149
reflectance, while the Mo2Se sample has a slightly decreased reflectance. The Mo2Se
sample also showed less severe degradation on the photographs. After 105 hours of
degradation, the reflectance of all samples except Mo2Se has decreased to around
10%, as seen in Figure 5.15. The low pressure sample with selenide is thus the only
sample which largely retains its reflective properties.
5.3.2 Lift-off experiment
5.3.2.1 Visual changes
Damp heat exposure of the samples lead to the appearance of black and blue spots
as is shown in Figure 5.16 and Figure 5.17. This effect is stronger for Mo25/15, which
is likely caused by the high porosity of this sample, obtained due to the higher
deposition pressure. The changes are similar to the ones for the Mo/MoSe samples
2
in the ‘selenisation and pressure’ experiment, but it should be noted that the
degradation characteristics of the previous samples occurred faster than observed in
the ‘lift-off experiment’.
Figure 5.16
o
Photographs of Mo25/2 before and after 8, 32, 88 and 150 hours exposure to 85 C/85% RH. The width of the samples is 21
mm. The first pictures shows both the sample for degradation and the reference sample.
Figure 5.17
Photographs of Mo25/15 before and after 8, 32, 88 and 150 hours exposure to 85 o C/85% RH. The width of the sample is 25 mm.
The degraded area was studied more thoroughly with a microscope as is shown
in Figure 5.18 and Figure 5.19. It was observed that the visual degradation of both
samples globally occurred in a similar way. The following steps can be distinguished
149