Page 153 - Mirjam-Theelen-Degradation-of-CIGS-solar-cells
P. 153
Degradation mechanisms of the molybdenum back contact
curves: Mo25/2 reflected better at wavelengths below 500 nm, while the porous
Mo25/15 reflected better above 500 nm. This difference is not yet explained.
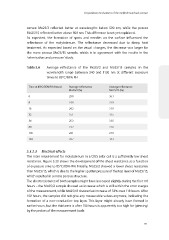
As expected, the formation of spots and needles on the surface influenced the
reflectance of the molybdenum. The reflectance decreased due to damp heat
treatment. As expected based on the visual changes, the decrease was larger for
the more porous Mo25/15 sample, which is in agreement with the results in the
‘selenisation and pressure’ study.
Table 5.6 Average reflectance of the Mo25/2 and Mo25/15 samples iin the
wavelength range between 340 and 1120 nm at different exposure
o C/8 times to 855% RH
Time at 85 C/85% RH (hours) Average reflectance Average reflectance
o
Mo25/2 (%) Mo25/15 (%)
0 29.0 36.1
8 24.8 31.9
16 24.2 31.9
32 25.1 31.5
56 25.3 33.5
88 23.2 27.6
118 24.1 21.9
150 20.7 14.3
5.3.2.3 Electrical effects
The main requirement for molybdenum in a CIGS solar cell is a sufficiently low sheet
resistance. Figure 5.20 shows the development of the sheet resistance as a function
o
of exposure time to 85C/85% RH. Initially, Mo25/2 showed a lower sheet resistance
than Mo25/15, which is due to the higher sputter pressure of the top layer of Mo25/15,
which resulted in a more porous structure.
The sheet resistance of both samples might have increased slightly during the first 118
hours – the Mo25/2 sample showed an increase which is still within the error margin
of the measurement, while Mo25/15 showed an increase of 33% over 118 hours. After
150 hours, the samples did not give any measurable values anymore, indicating the
formation of a non-conductive top layer. This layer might already have formed in
earlier hours, but the thickness is after 150 hours is apparently too high for ‘piercing’
by the probes of the measurement tools.
151
curves: Mo25/2 reflected better at wavelengths below 500 nm, while the porous
Mo25/15 reflected better above 500 nm. This difference is not yet explained.
As expected, the formation of spots and needles on the surface influenced the
reflectance of the molybdenum. The reflectance decreased due to damp heat
treatment. As expected based on the visual changes, the decrease was larger for
the more porous Mo25/15 sample, which is in agreement with the results in the
‘selenisation and pressure’ study.
Table 5.6 Average reflectance of the Mo25/2 and Mo25/15 samples iin the
wavelength range between 340 and 1120 nm at different exposure
o C/8 times to 855% RH
Time at 85 C/85% RH (hours) Average reflectance Average reflectance
o
Mo25/2 (%) Mo25/15 (%)
0 29.0 36.1
8 24.8 31.9
16 24.2 31.9
32 25.1 31.5
56 25.3 33.5
88 23.2 27.6
118 24.1 21.9
150 20.7 14.3
5.3.2.3 Electrical effects
The main requirement for molybdenum in a CIGS solar cell is a sufficiently low sheet
resistance. Figure 5.20 shows the development of the sheet resistance as a function
o
of exposure time to 85C/85% RH. Initially, Mo25/2 showed a lower sheet resistance
than Mo25/15, which is due to the higher sputter pressure of the top layer of Mo25/15,
which resulted in a more porous structure.
The sheet resistance of both samples might have increased slightly during the first 118
hours – the Mo25/2 sample showed an increase which is still within the error margin
of the measurement, while Mo25/15 showed an increase of 33% over 118 hours. After
150 hours, the samples did not give any measurable values anymore, indicating the
formation of a non-conductive top layer. This layer might already have formed in
earlier hours, but the thickness is after 150 hours is apparently too high for ‘piercing’
by the probes of the measurement tools.
151