Page 152 - Mirjam-Theelen-Degradation-of-CIGS-solar-cells
P. 152
Chapter 5
1mm
Figure 5.18
Microscopy photos of Mo25/2 (left) and Mo25/15 (right) after 8 hours of damp heat exposure.
1mm
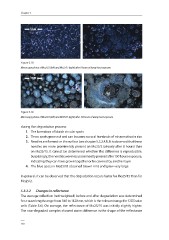
Figure 5.19
Microscopy photos of Mo25/2 (left) and Mo25/15 (right) after 150 hours of damp heat exposure.
during the degradation process:
1. The formation of bluish circular spots
2. These spots grow out and can become several hundreds of micrometres in size
3. Needles are formed on the surface (see chapter 5.3.2.4.1). It is observed that these
needles are more prominently present on Mo25/2 (already after 8 hours) than
on Mo25/15. It cannot be determined whether this difference is reproducible.
Surprisingly, the needles were less prominently present after 150 hours exposure,
indicating they can have grown together or be covered by another layer
4. The blue spots in Mo25/15 obtained brown rims and grow very large
In general, it can be observed that the degradation occurs faster for Mo25/15 than for
Mo25/2.
5.3.2.2 Changes in reflectance
The average reflection (not weighted) before and after degradation was determined
for a wavelength range from 340 to 1120 nm, which is the relevant range for CIGS solar
cells (Table 5.6). On average, the reflectance of Mo25/15 was initially slightly higher.
The non-degraded samples showed some difference in the shape of the reflectance
150
1mm
Figure 5.18
Microscopy photos of Mo25/2 (left) and Mo25/15 (right) after 8 hours of damp heat exposure.
1mm
Figure 5.19
Microscopy photos of Mo25/2 (left) and Mo25/15 (right) after 150 hours of damp heat exposure.
during the degradation process:
1. The formation of bluish circular spots
2. These spots grow out and can become several hundreds of micrometres in size
3. Needles are formed on the surface (see chapter 5.3.2.4.1). It is observed that these
needles are more prominently present on Mo25/2 (already after 8 hours) than
on Mo25/15. It cannot be determined whether this difference is reproducible.
Surprisingly, the needles were less prominently present after 150 hours exposure,
indicating they can have grown together or be covered by another layer
4. The blue spots in Mo25/15 obtained brown rims and grow very large
In general, it can be observed that the degradation occurs faster for Mo25/15 than for
Mo25/2.
5.3.2.2 Changes in reflectance
The average reflection (not weighted) before and after degradation was determined
for a wavelength range from 340 to 1120 nm, which is the relevant range for CIGS solar
cells (Table 5.6). On average, the reflectance of Mo25/15 was initially slightly higher.
The non-degraded samples showed some difference in the shape of the reflectance
150