Page 148 - Mirjam-Theelen-Degradation-of-CIGS-solar-cells
P. 148
Chapter 5
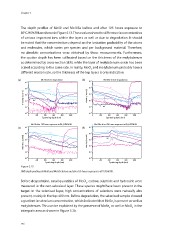
The depth profiles of Mo10 and Mo10Se before and after 105 hours exposure to
85 C/85% RH are shown in Figure 5.13. These values show the difference in concentration
o
of various important ions within the layers as well as due to degradation. It should
be noted that the concentrations depend on the ionisation probability of the atoms
and molecules, which varies per species and per background material. Therefore,
no absolute concentrations were obtained by these measurements. Furthermore,
the sputter depth has been calibrated based on the thickness of the molybdenum
as determined by cross-section SEM, while the layer of molybdenum oxide has been
scaled according to the same rate. In reality, MoO and molybdenum probably have a
3
different erosion rate, so the thickness of the top layers is only indicative.
(a) Mo10 before degradation (b) 5 Mo10Se before degradation
10 5 10
Se
10 4 MoO 3 - 10 4 MoO 3 - -
Intensity (counts) 10 3 2 S - NO - C - H - Intensity (counts) 10 3 2 H - Cl Si - - S C - -
10
10
10 1 Si - Cl - 10 1 NO -
Se -
10 0 10 0
0 200 400 600 800 1000 0 200 400 600 800 1000
Sputtering depth (nm) Sputtering depth (nm)
Mo10 after 105 hours exposure to 85 oC/85% RH Mo10Se after 105 hours exposure to 85 oC/85% RH
(c) 10 5 (d) 10 5 MoO 3 -
H - Se -
-
10 4 Cl - MoO 3 - 10 4 - C S - -
Intensity (counts) 10 3 2 S - NO - C - Intensity (counts) 10 3 2 NO Cl - Si -
H
10
10
10 1 Si - 10 1
Se -
10 0 10 0
0 200 400 600 800 1000 0 200 400 600 800 1000
Sputtering depth (nm) Sputtering depth (nm)
Figure 5.13
SIMS depth profiling of Mo10 and Mo10Se before and after 105 hours exposure to 85 C/85% RH.
o
Before degradation, small quantities of MoO, carbon, sulphide and hydroxide were
3
measured in the non-selenised layer. These species might have been present in the
target. In the selenised layer, high concentrations of selenium were naturally also
present, mainly in the top 400 nm. Before degradation, the selenised sample showed
a gradient in selenium concentration, which indicated that MoSe is present as well as
2
molybdenum. This can be explained by the presence of MoSe as well as MoO in the
3
2
intergrain area as shown in Figure 5.2b.
146