Page 149 - Mirjam-Theelen-Degradation-of-CIGS-solar-cells
P. 149
Degradation mechanisms of the molybdenum back contact
The SIMS measurement on the non-selenised sample showed a large increase in MoO
3
concentration near the surface due to damp heat exposure. The top 100 nm layer
mainly contained MoO, which was also present in the whole layer at a decreasing
3
concentration to the bottom of the layer. Small quantities of chloride were found
at the Mo/MoO interface, while carbon, nitride-like materials and sulphide were
3
present in the MoO layer. These species were also present before degradation, but
3
their concentration near the surface had increased. These elements might originate
from the air or the vapourised demineralised water.
For the selenised sample, a clear two-layer structure was also formed after degrada-
tion. The top layer consisted mainly of MoO with increased amounts of hydrogen and
3
nitrate. The selenium content was very low in this layer, indicating that the selenium
was not incorporated in the molybdenum oxide layer. Approximately 300 nm from
the surface, an intermediate layer was formed. This layer had an increased content of
hydrogen, carbon, sulphur and to a lesser extent chloride. The selenium content at
this position was comparable to the initial selenium content at the surface.
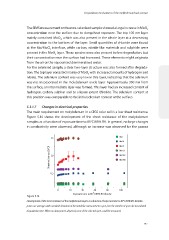
5.3.1.7 Changes in electrical properties
The main requirement on molybdenum in a CIGS solar cell is a low sheet resistance.
Figure 5.14 shows the development of the sheet resistance of the molybdenum
o
samples as a function of exposure time to 85 C/85% RH. In general, no large changes
in conductivity were observed, although an increase was observed for the porous
1,5 Mo2
Mo10
Mo15
Sheet resistance (Ω/ ) 1,0 Mo2Se
Mo10Se
Mo15Se
0,5
0 20 40 60 80 100
o
Exposure time to 85 C/85% RH (hours)
Figure 5.14
o
Development of the sheet resistance of the molybdenum layers as a function of exposure time to 85 C/85% RH. All data
points are averages with standard deviation of the initial five measurements spots, but the number of spots decreased with
degradation time. When no data point is depicted, none of the selected spots could be measured.
147
The SIMS measurement on the non-selenised sample showed a large increase in MoO
3
concentration near the surface due to damp heat exposure. The top 100 nm layer
mainly contained MoO, which was also present in the whole layer at a decreasing
3
concentration to the bottom of the layer. Small quantities of chloride were found
at the Mo/MoO interface, while carbon, nitride-like materials and sulphide were
3
present in the MoO layer. These species were also present before degradation, but
3
their concentration near the surface had increased. These elements might originate
from the air or the vapourised demineralised water.
For the selenised sample, a clear two-layer structure was also formed after degrada-
tion. The top layer consisted mainly of MoO with increased amounts of hydrogen and
3
nitrate. The selenium content was very low in this layer, indicating that the selenium
was not incorporated in the molybdenum oxide layer. Approximately 300 nm from
the surface, an intermediate layer was formed. This layer had an increased content of
hydrogen, carbon, sulphur and to a lesser extent chloride. The selenium content at
this position was comparable to the initial selenium content at the surface.
5.3.1.7 Changes in electrical properties
The main requirement on molybdenum in a CIGS solar cell is a low sheet resistance.
Figure 5.14 shows the development of the sheet resistance of the molybdenum
o
samples as a function of exposure time to 85 C/85% RH. In general, no large changes
in conductivity were observed, although an increase was observed for the porous
1,5 Mo2
Mo10
Mo15
Sheet resistance (Ω/ ) 1,0 Mo2Se
Mo10Se
Mo15Se
0,5
0 20 40 60 80 100
o
Exposure time to 85 C/85% RH (hours)
Figure 5.14
o
Development of the sheet resistance of the molybdenum layers as a function of exposure time to 85 C/85% RH. All data
points are averages with standard deviation of the initial five measurements spots, but the number of spots decreased with
degradation time. When no data point is depicted, none of the selected spots could be measured.
147